Overview
The article "9 Essential Server Performance Metrics for Developers" addresses a common challenge developers face: enhancing server performance. It identifies critical metrics that are vital for monitoring, ensuring that systems run efficiently. Key metrics outlined include:
- Uptime
- Average response time
- Peak response time
- Requests per second
- Error rates
- Hardware utilization
- Network bandwidth
- Disk usage
- Thread count
These metrics are essential for maintaining system efficiency and user satisfaction, highlighting their significance in effective resource management. By understanding and tracking these metrics, developers can significantly improve their server performance and overall productivity.
Introduction
In the fast-paced world of technology, developers often face significant challenges in optimizing server performance and streamlining workflows. How can these hurdles be overcome? Enter Kodezi—a transformative tool that stands out by providing a robust solution for generating OpenAPI specifications and automating essential processes like documentation and code reviews. Furthermore, Kodezi allows developers to concentrate on refining their code, which not only enhances productivity but also markedly improves server efficiency.
As organizations strive to meet growing user demands and ensure high uptime, understanding key performance metrics becomes crucial. Metrics such as average response time, peak response time, and error rates are essential for gauging server performance. This article will explore the importance of these metrics and illustrate how leveraging innovative tools like Kodezi can empower developers to achieve optimal server performance, all while ensuring a seamless user experience. Are you ready to discover how Kodezi can elevate your coding practices?
Kodezi | Professional OpenAPI Specification Generator - AI Dev-Tool: Enhance Server Performance Monitoring
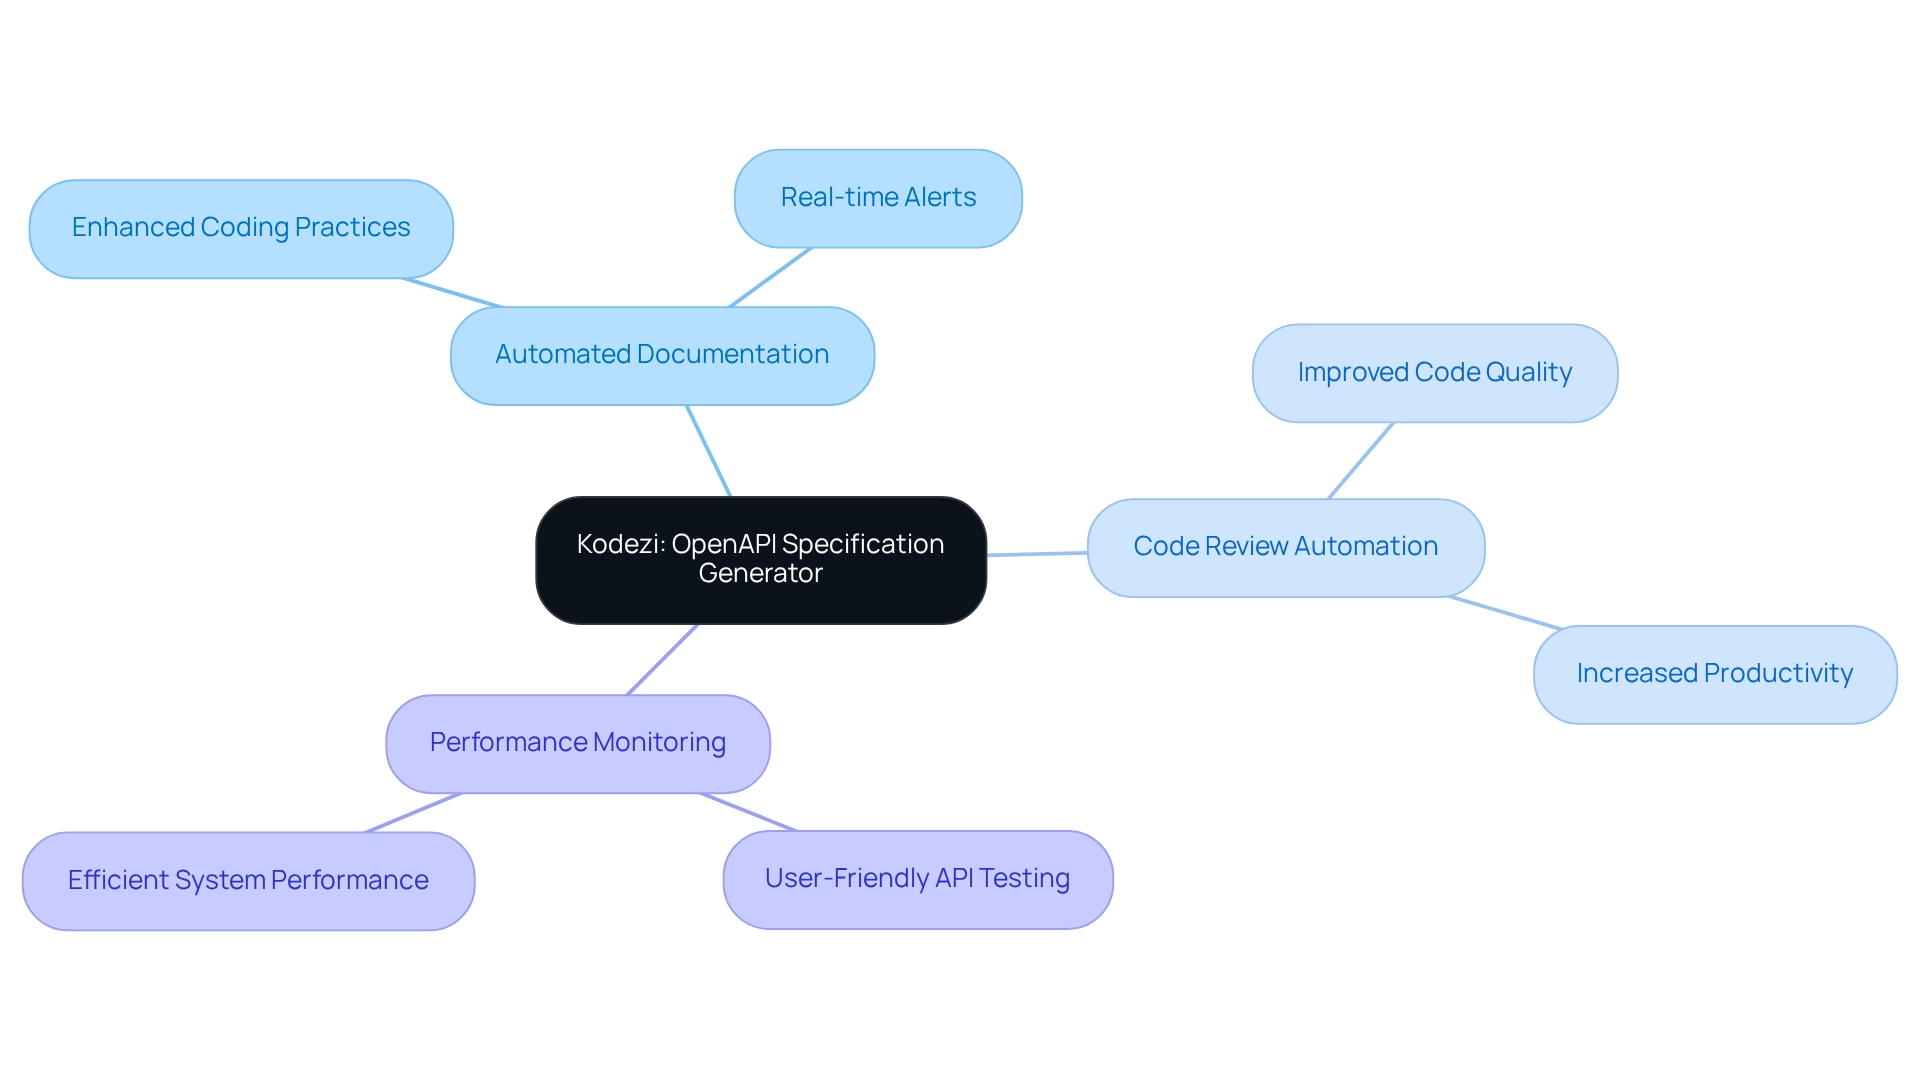
Developers often face significant challenges when it comes to maintaining efficient coding practices and documentation. Kodezi emerges as a robust resource that simplifies these processes, particularly in creating OpenAPI specifications that enhance system monitoring. By automating the documentation procedure, Kodezi allows programmers to focus on improving their code and overall system efficiency.
With its comprehensive suite of developer tools, Kodezi not only automates code reviews but also keeps API documentation aligned with code changes. This ensures that developers can effortlessly monitor and enhance their system's performance by utilizing server performance metrics. Features such as the automatic generation of OpenAPI 3.0 specifications and the hosting of Swagger UI sites for API testing make Kodezi an essential asset in modern development workflows.
Imagine having over 1,000,000 users benefiting from a tool that transforms coding practices and significantly boosts productivity. As Martin Norato Auer, VP of CX Observability Services, highlights, "We get Catchpoint alerts within seconds when a site is down. And we can, within three minutes, identify exactly where the issue is coming from and inform our customers and work with them." This statement underscores the critical role of automated documentation in swiftly addressing system issues.
In essence, Kodezi equips programmers with resources that streamline coding and enhance their understanding of server performance metrics through its innovative OpenAPI specification generation. Are you ready to explore the tools available on the Kodezi platform and elevate your coding efficiency?
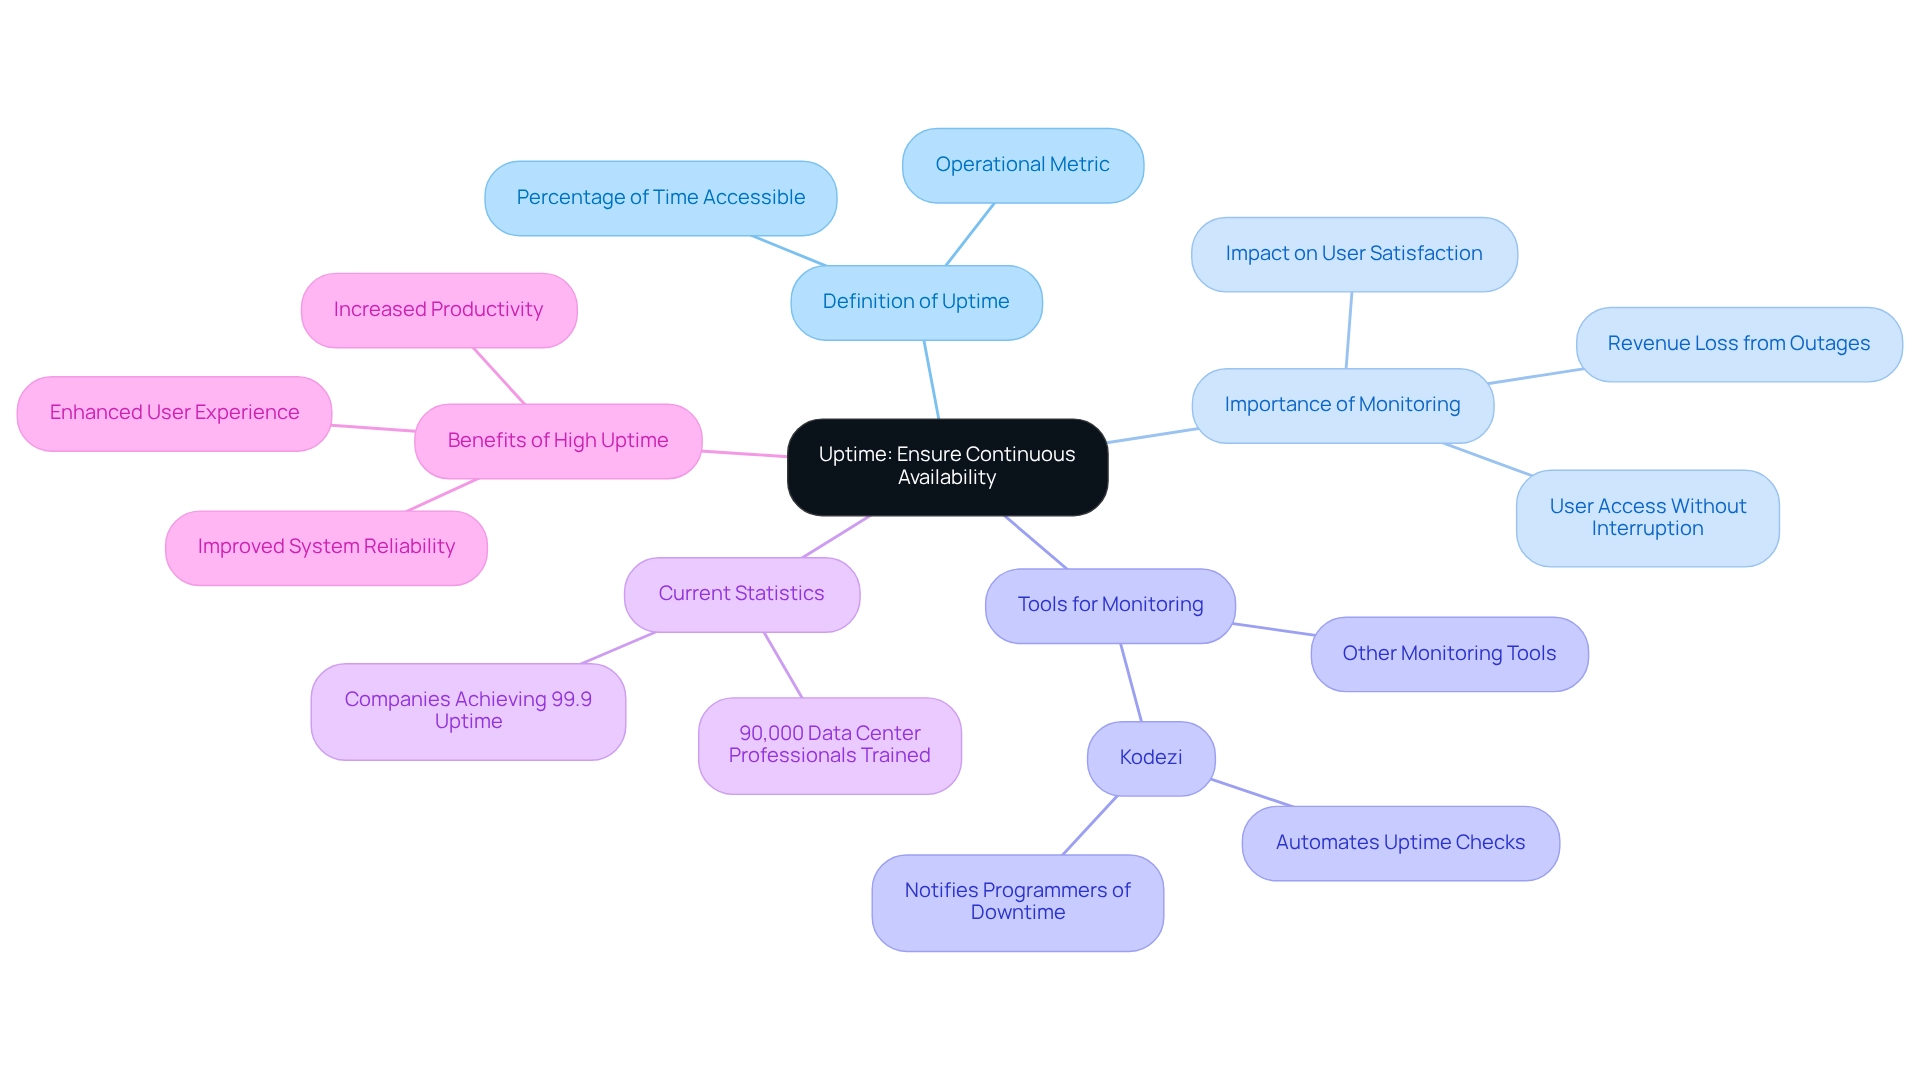
Uptime: Ensure Continuous Availability of Your Server
Uptime: Ensure Continuous Availability of Your System
Uptime is a crucial metric that indicates the percentage of time a system remains operational and accessible. Have you ever faced challenges with system availability? Continuous monitoring of uptime is vital to guarantee that users can access services without interruption. Tools like Kodezi simplify this process by automating uptime checks and quickly notifying programmers of any downtime incidents. Striving for 99.9% uptime is a standard objective, as even brief outages can result in considerable user dissatisfaction and potential revenue loss.
In 2025, current uptime statistics reveal that many companies are achieving this benchmark. This underscores the importance of effective uptime monitoring strategies. By implementing robust monitoring tools, developers can improve system reliability and ensure a seamless user experience. Furthermore, using Kodezi can enhance your productivity and code quality. Begin for free with Kodezi today and see how our tool can improve your uptime monitoring and system reliability. Schedule a demo to see Kodezi in action!
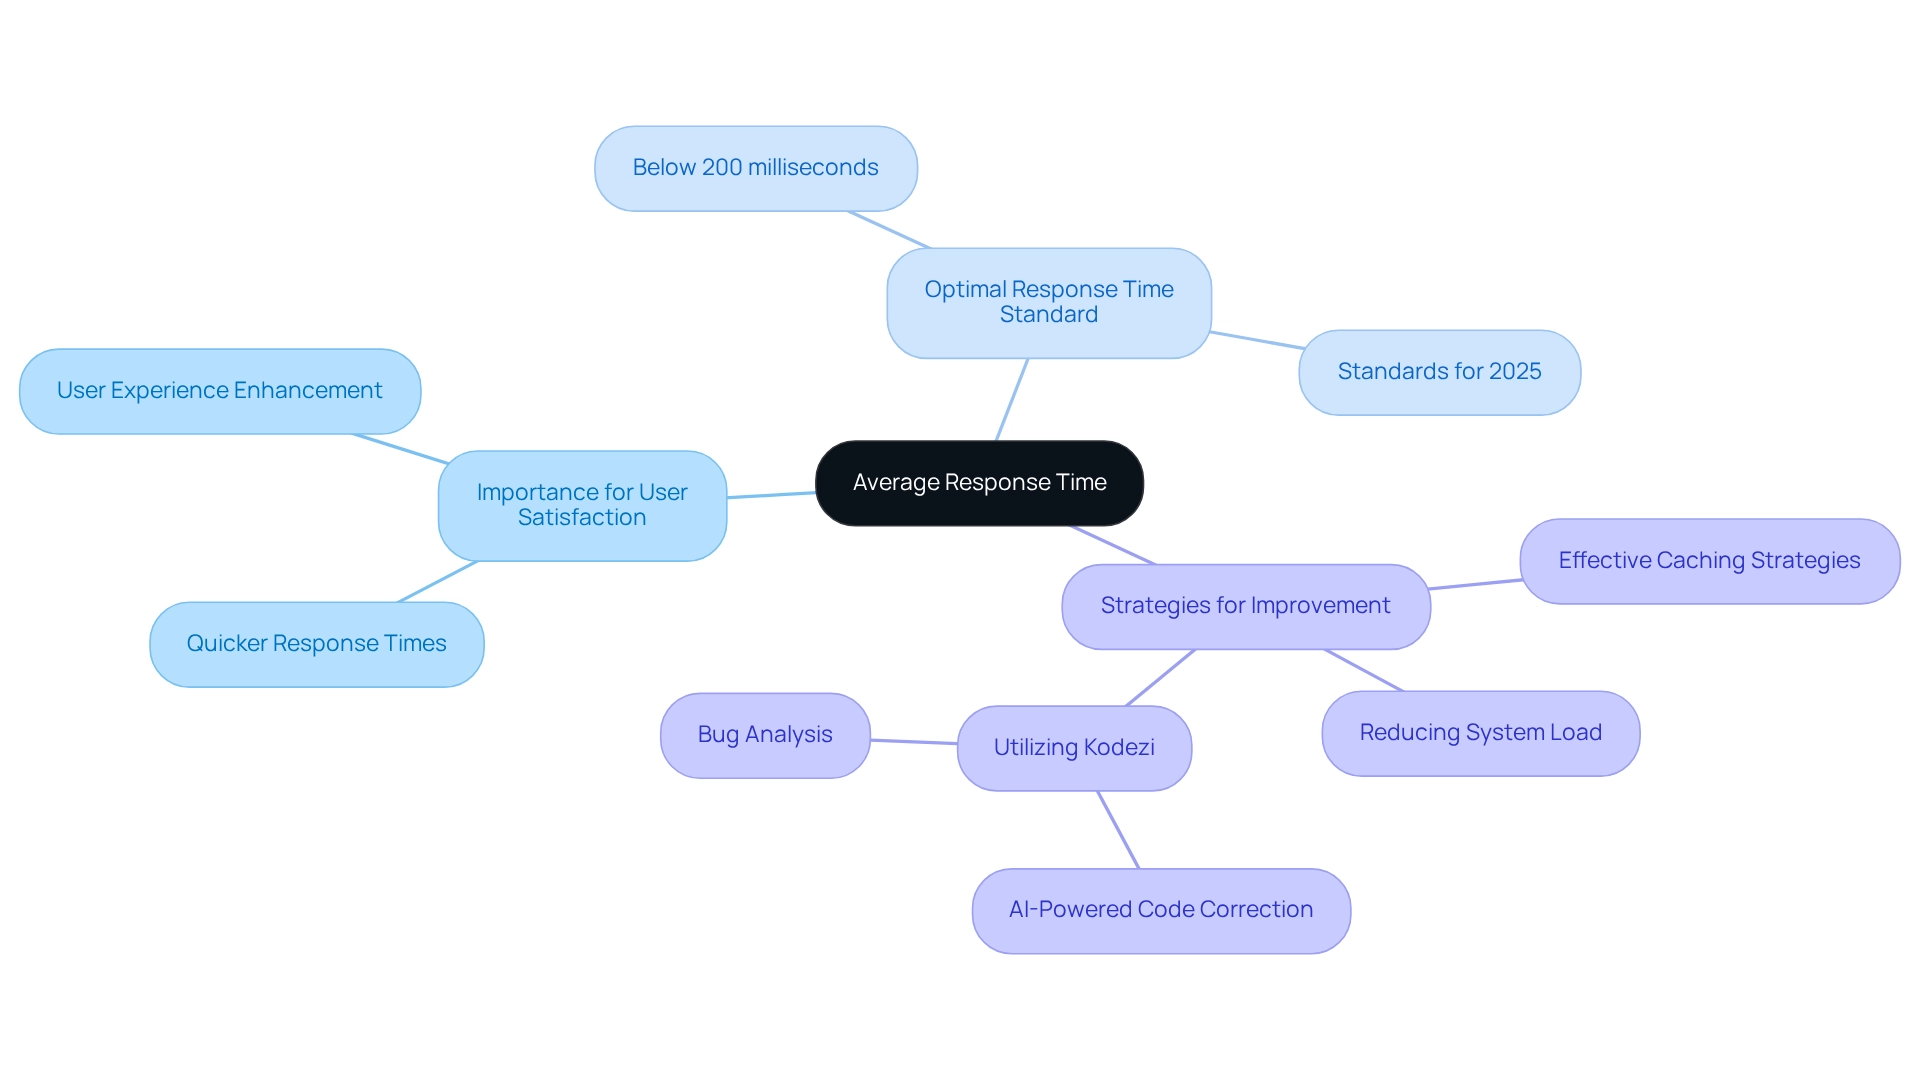
Average Response Time: Measure User Experience Effectively
Average response time is a critical metric that measures how long a system takes to respond to a request. Why does this matter? Because quicker response times are closely linked to improved user satisfaction. Research shows that maintaining average response times below 200 milliseconds is essential for delivering a seamless experience. Furthermore, developers can utilize tools like Kodezi to effectively monitor and enhance this metric, leveraging its AI-powered capabilities for automatic code correction and bug analysis.
In addition, recommended methods for achieving optimal response times include:
- Implementing effective caching strategies
- Reducing system load
By focusing on these strategies and utilizing Kodezi, professionals can ensure their software aligns with the average response time standards for 2025. This not only meets user expectations but also significantly enhances the overall user experience. Are you ready to explore how Kodezi can transform your coding practices and boost productivity?
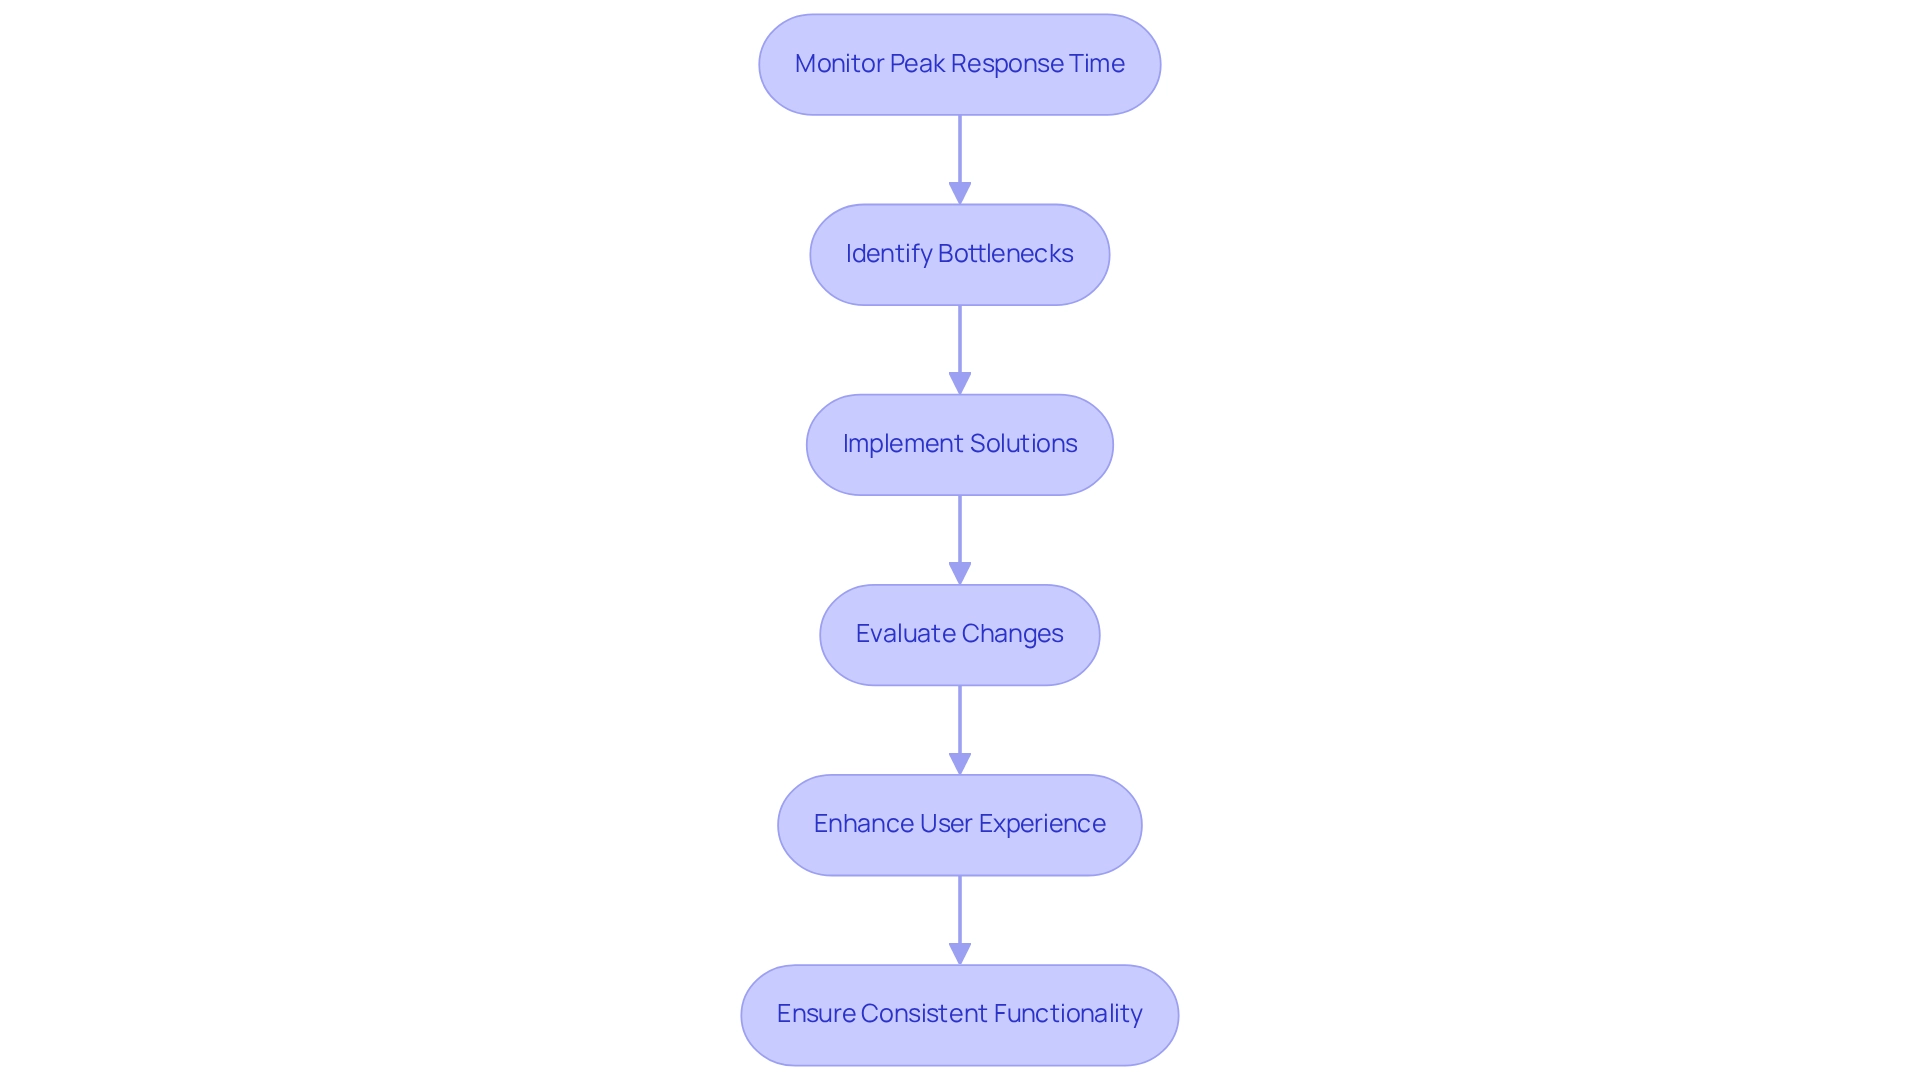
Peak Response Time: Assess Performance Under Load
Peak response time is a critical metric that defines the maximum duration a server takes to respond within a specified timeframe. This measurement becomes particularly vital during peak traffic occurrences, offering programmers valuable insights into software efficiency under pressure. By closely observing peak response times, developers can identify potential bottlenecks and areas in need of enhancement, ensuring systems remain responsive even during traffic surges.
Furthermore, recent studies indicate that peak response time serves as a key indicator of scalability, especially when assessing how systems manage maximum load. For instance, a notable case study illustrated a scenario where high error rates during payment processing were traced back to an overloaded payment gateway API. By implementing request throttling and a retry mechanism, the development team successfully reduced error rates by 80%, significantly enhancing the user checkout experience.
Experts emphasize that consistent functionality is crucial for business success, particularly in situations where traffic can surge unexpectedly. While general guidelines suggest that Apdex scores exceeding 0.7 are beneficial, ideal values may vary depending on specific details and user expectations, necessitating the creation of custom benchmarks. Current data underscores the importance of monitoring server performance metrics and peak response times during heavy traffic events to preserve functionality, as even minor delays can adversely affect user satisfaction and retention. In summary, understanding and managing server performance metrics is vital for enhancing system efficiency, especially during high-demand intervals. By leveraging insights from system engineers and real-world case studies, developers can bolster their applications' resilience and responsiveness.
Requests Per Second: Gauge Server Capacity
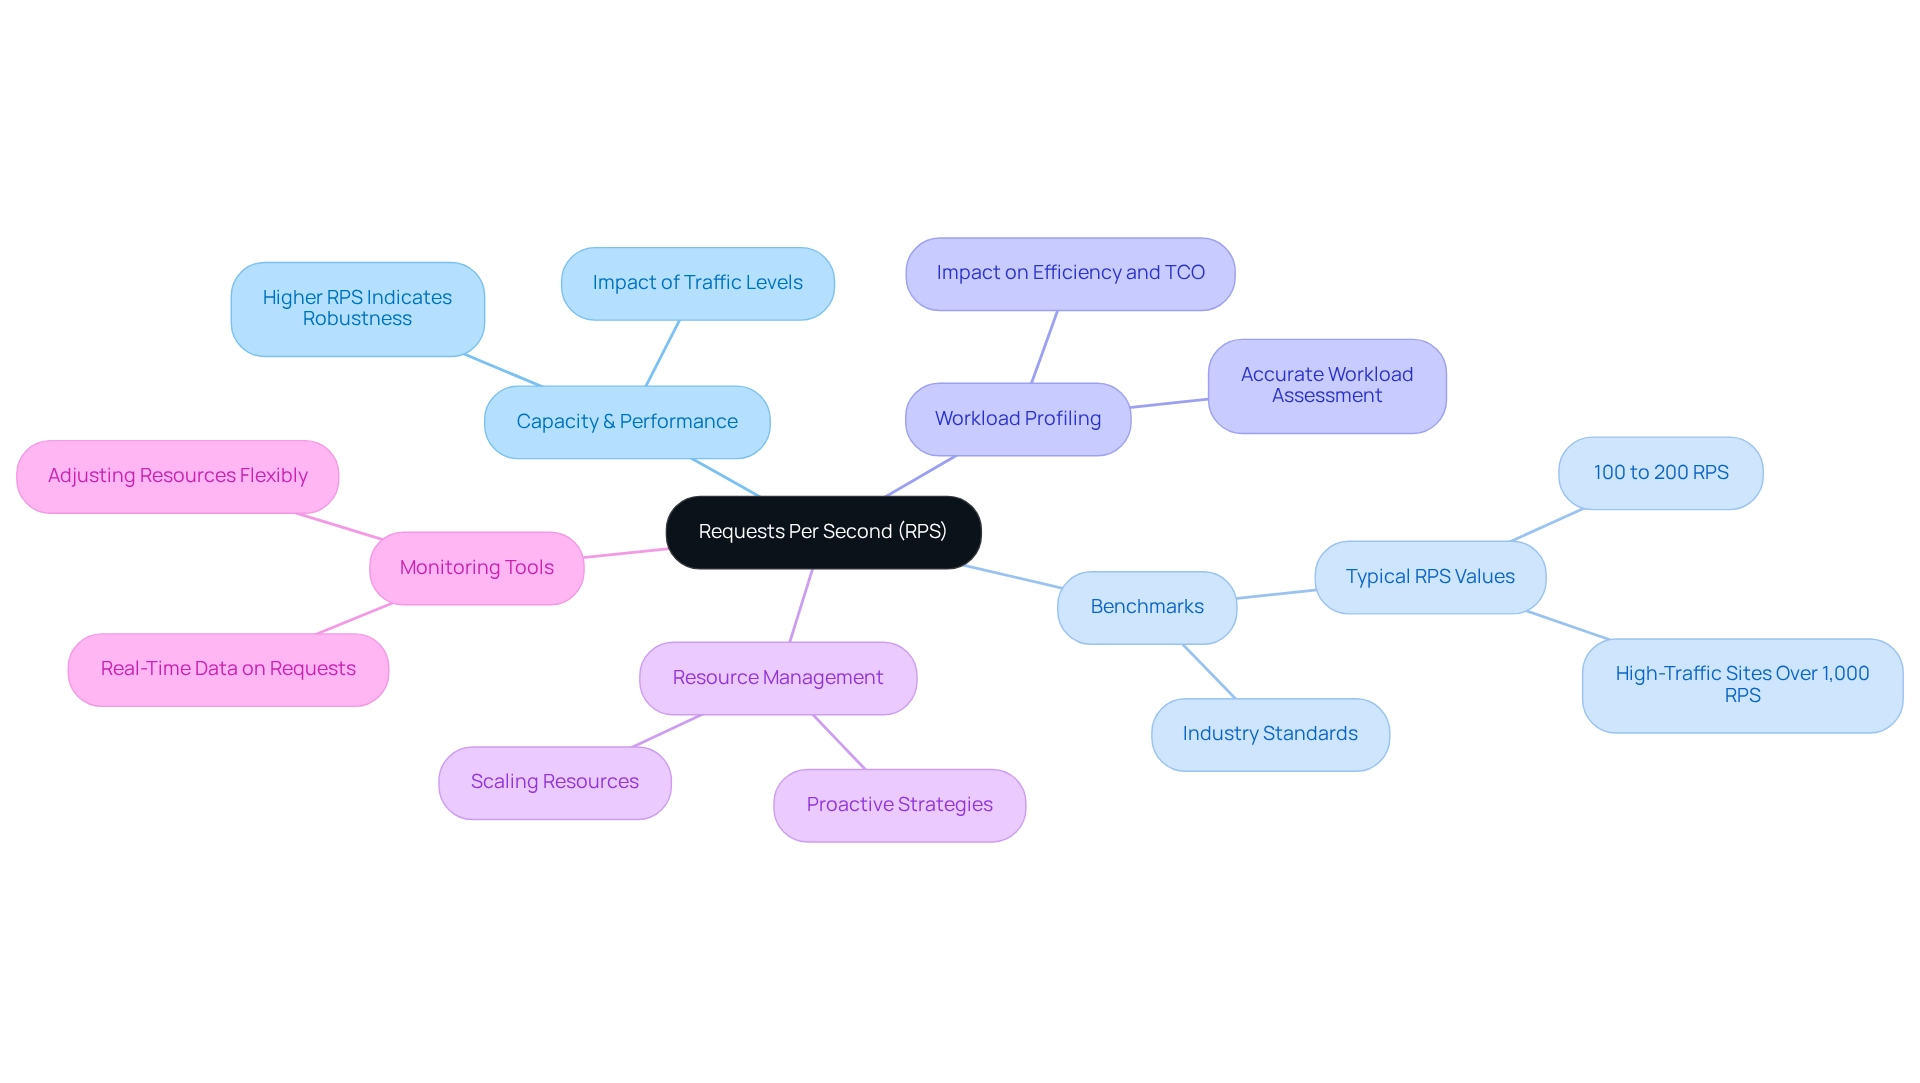
Requests per second (RPS) serves as a vital metric, measuring the number of requests a system can manage in just one second. This figure acts as a key indicator of both capacity and performance. Have you ever wondered how powerful your system really is? A higher RPS indicates a more robust system, yet it requires careful resource management to avoid overload. Developers must consistently monitor server performance metrics to ensure their systems can accommodate expected traffic levels, especially during peak usage times. Understanding server performance metrics is essential for enhancing system performance. For example, industry benchmarks reveal that popular web applications typically handle an average of 100 to 200 RPS under normal conditions, with some high-traffic sites achieving over 1,000 RPS. This highlights the importance of effectively scaling computing resources to meet demand. Are your resources keeping pace with your traffic?
Recent insights emphasize that evaluating RPS should extend beyond basic metrics. It is crucial to accurately profile workloads to grasp the true impact of new technologies on efficiency and total cost of ownership (TCO). A case study on workload profiling showed that while standard benchmarks provide valuable information, they must be complemented with detailed assessments to fully understand system capabilities.
Furthermore, expert opinions underscore the need for proactive resource management. Developers are encouraged to leverage monitoring tools that deliver real-time data on requests, enabling them to adjust resources flexibly and maintain optimal efficiency. As industry leaders point out, understanding the comparative cost elements of infrastructure is essential for both application developers and system operators, especially when it comes to analyzing server performance metrics. In summary, effectively measuring and managing RPS is crucial for ensuring that systems can handle high traffic volumes without sacrificing performance, particularly during peak times. Are you ready to take control of your system's efficiency?
Error Rates: Identify and Resolve Performance Issues
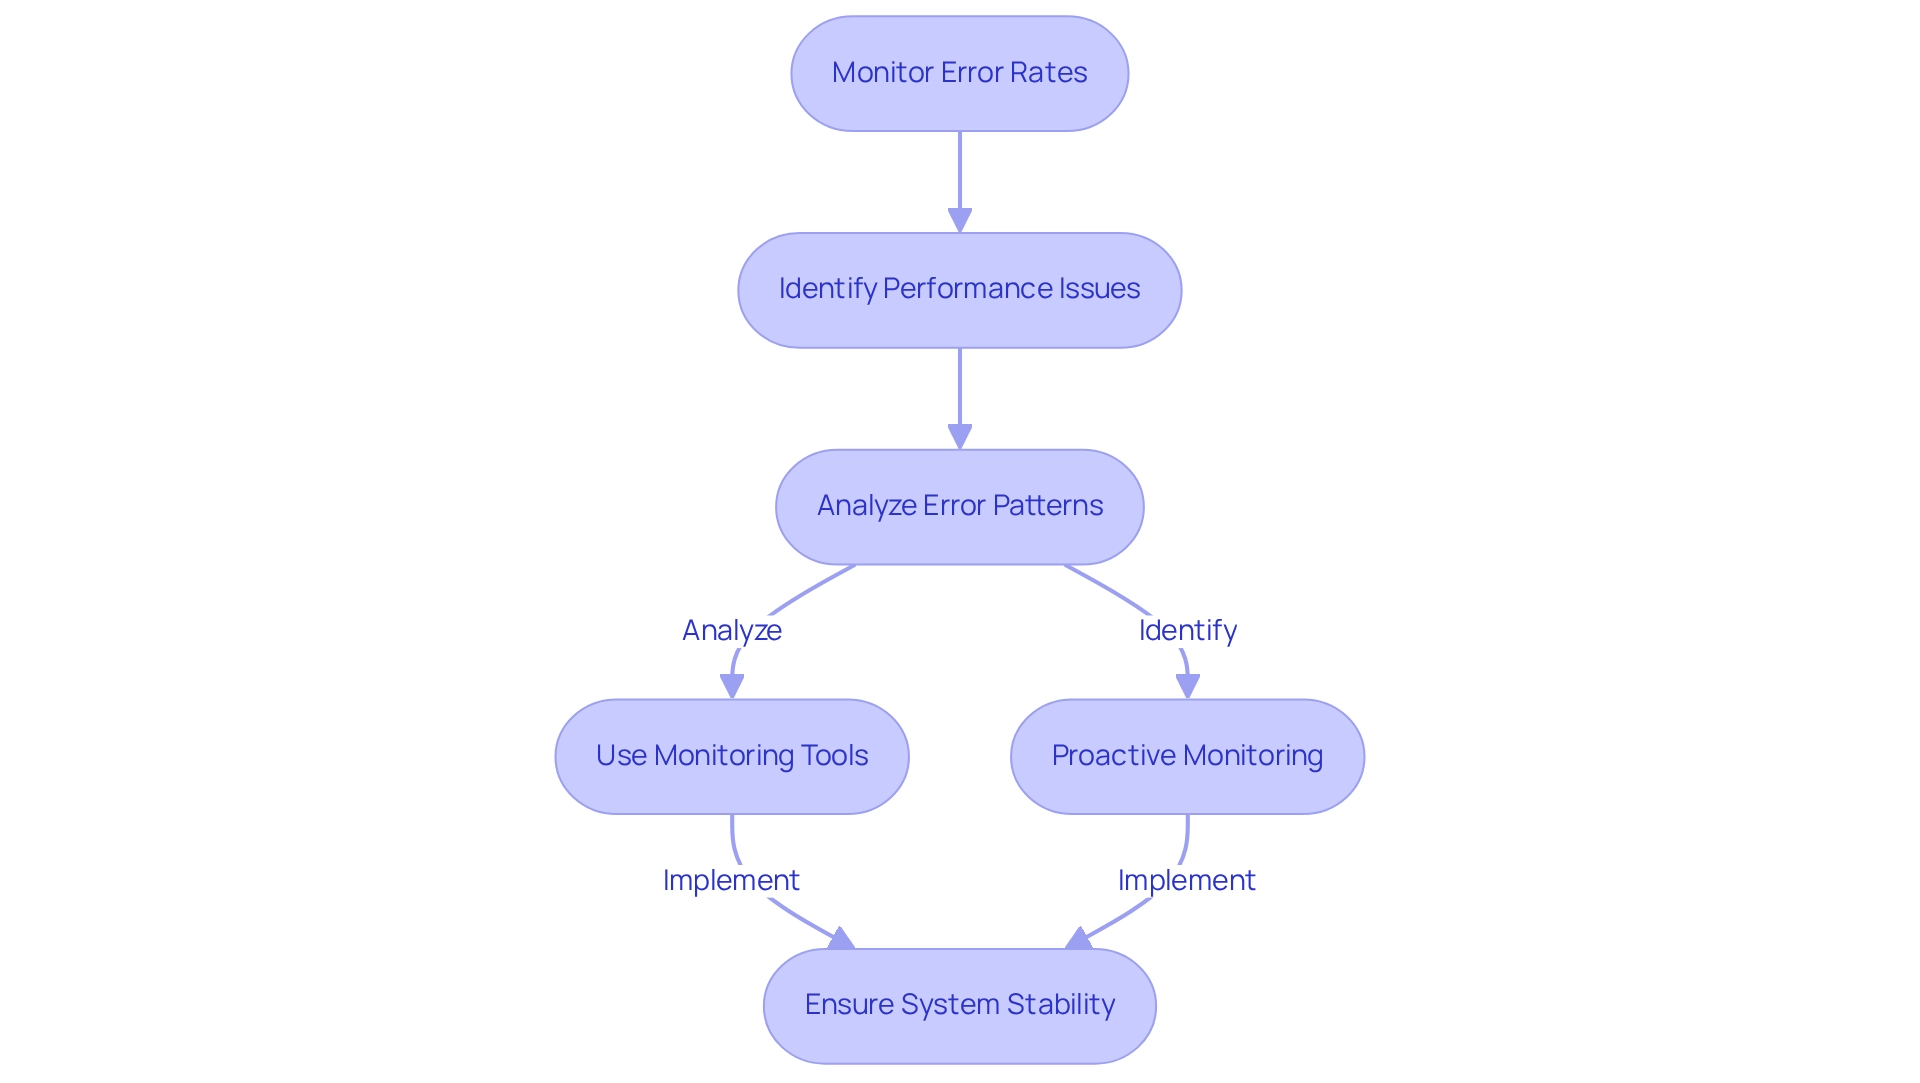
Error rates represent the percentage of unsuccessful requests in relation to total requests, serving as a vital indicator of system health. When error rates rise, it often signals underlying issues within the system or application, which can significantly impact user experience. For example, if a pipeline experiences a critical failure every 500 hours on average, this results in a mean time between critical failures (MTBCF) of 500 hours. This scenario underscores the necessity for proactive monitoring of server performance metrics.
To tackle these challenges effectively, programmers should leverage monitoring tools like Sentry or Getgauge that provide real-time tracking of error rates. This capability allows for the swift identification and resolution of issues. Regularly analyzing error patterns not only aids in troubleshooting but also enhances overall application stability and functionality. As Joydip Kanjilal, a respected creator and author, notes, "The appropriate metrics forecast issues clients may face before they arise."
Recognizing the implications of high error rates is essential; they can result in false positives in decision-making processes, akin to the Type 1 error rate seen in various fields. This awareness is crucial to avert negative outcomes, such as decreased user satisfaction or lost business opportunities. By employing robust monitoring techniques and utilizing analytical tools, developers can effectively monitor and assess server performance metrics and error rates, thereby ensuring system stability and a seamless user experience.
Hardware Utilization: Optimize Resource Allocation
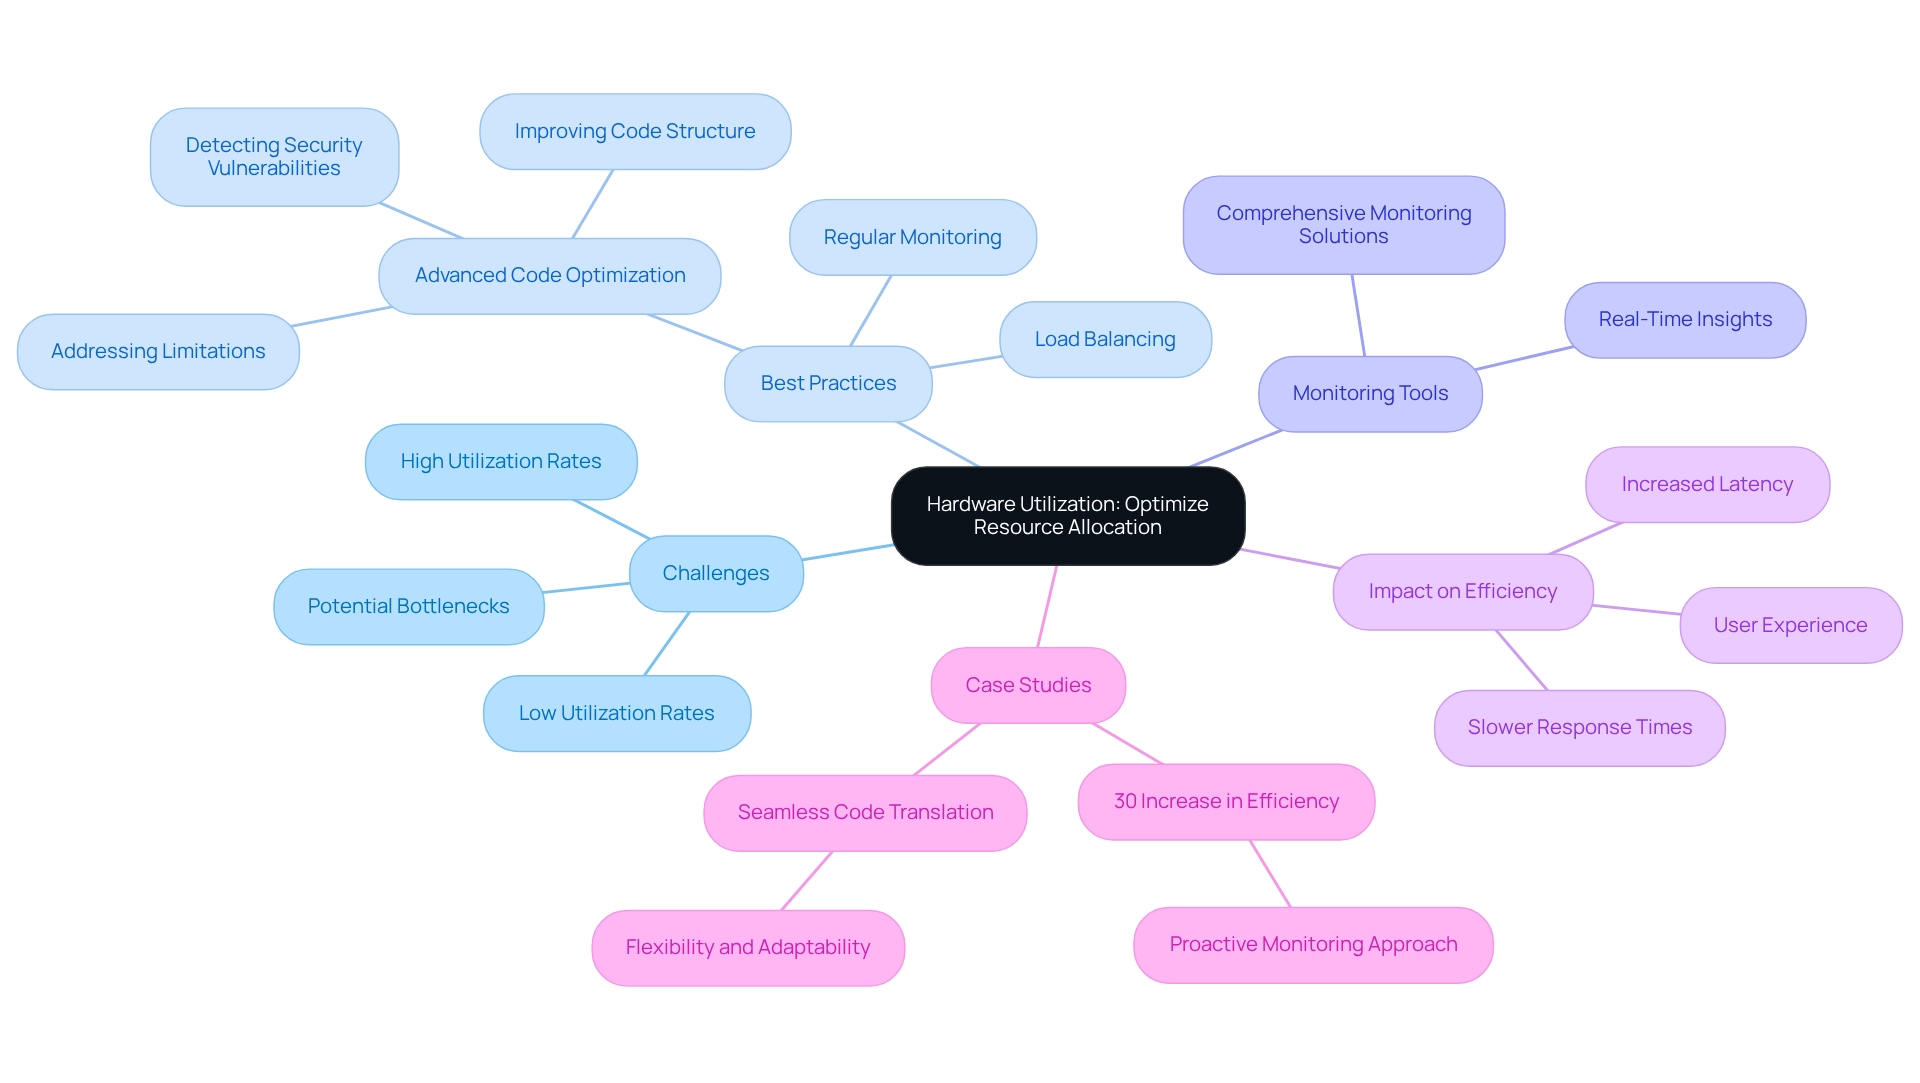
Developers often face significant challenges related to hardware utilization metrics, particularly concerning CPU and memory usage. These metrics are essential indicators of system functionality and resource efficiency. High utilization rates frequently indicate that a system is under considerable load, potentially leading to bottlenecks if not handled appropriately. Conversely, low utilization might suggest that resources are not being fully utilized, resulting in wasted capacity.
To achieve optimal results, developers should adopt best practices for managing CPU and memory usage. Regularly monitoring utilization metrics allows for the identification of trends and anomalies, informing effective resource allocation strategies. For instance, employing load balancing can distribute workloads uniformly across machines, preventing any individual machine from becoming a bottleneck.
Furthermore, efficient resource distribution strategies are crucial for sustaining machine efficiency. Developers can utilize tools that provide real-time insights into CPU and memory usage, enabling informed decisions about scaling resources up or down based on current demands. In addition, enhancing software efficiency through advanced code refinement—such as addressing limitations, detecting security vulnerabilities, and improving code structure—can significantly decrease CPU and memory usage.
Expert insights underscore the importance of these metrics in maximizing hardware utilization. As one programmer noted, managing CPU and memory usage is essential for ensuring applications operate efficiently without overwhelming the system. This balance not only enhances functionality but also extends the lifespan of hardware by preventing overheating and deterioration.
The impact of hardware usage on system efficiency is profound. High CPU and memory usage can lead to slower response times and increased latency, ultimately affecting user experience. Consequently, programmers must prioritize tracking these metrics to ensure their systems function at maximum efficiency.
Case studies highlight the benefits of optimizing hardware usage. For example, a recent initiative demonstrated how a company improved system efficiency by implementing a comprehensive monitoring solution that provided insights into CPU and memory utilization. This proactive approach allowed for flexible resource distribution adjustments, resulting in a 30% increase in overall efficiency. In conclusion, understanding and optimizing CPU and memory utilization is vital for programmers aiming to enhance server performance metrics. By leveraging hardware utilization metrics and server performance metrics, along with adopting effective resource management strategies including advanced code optimization, developers can ensure their programs operate efficiently and reliably.
Network Bandwidth: Monitor Data Transfer Efficiency
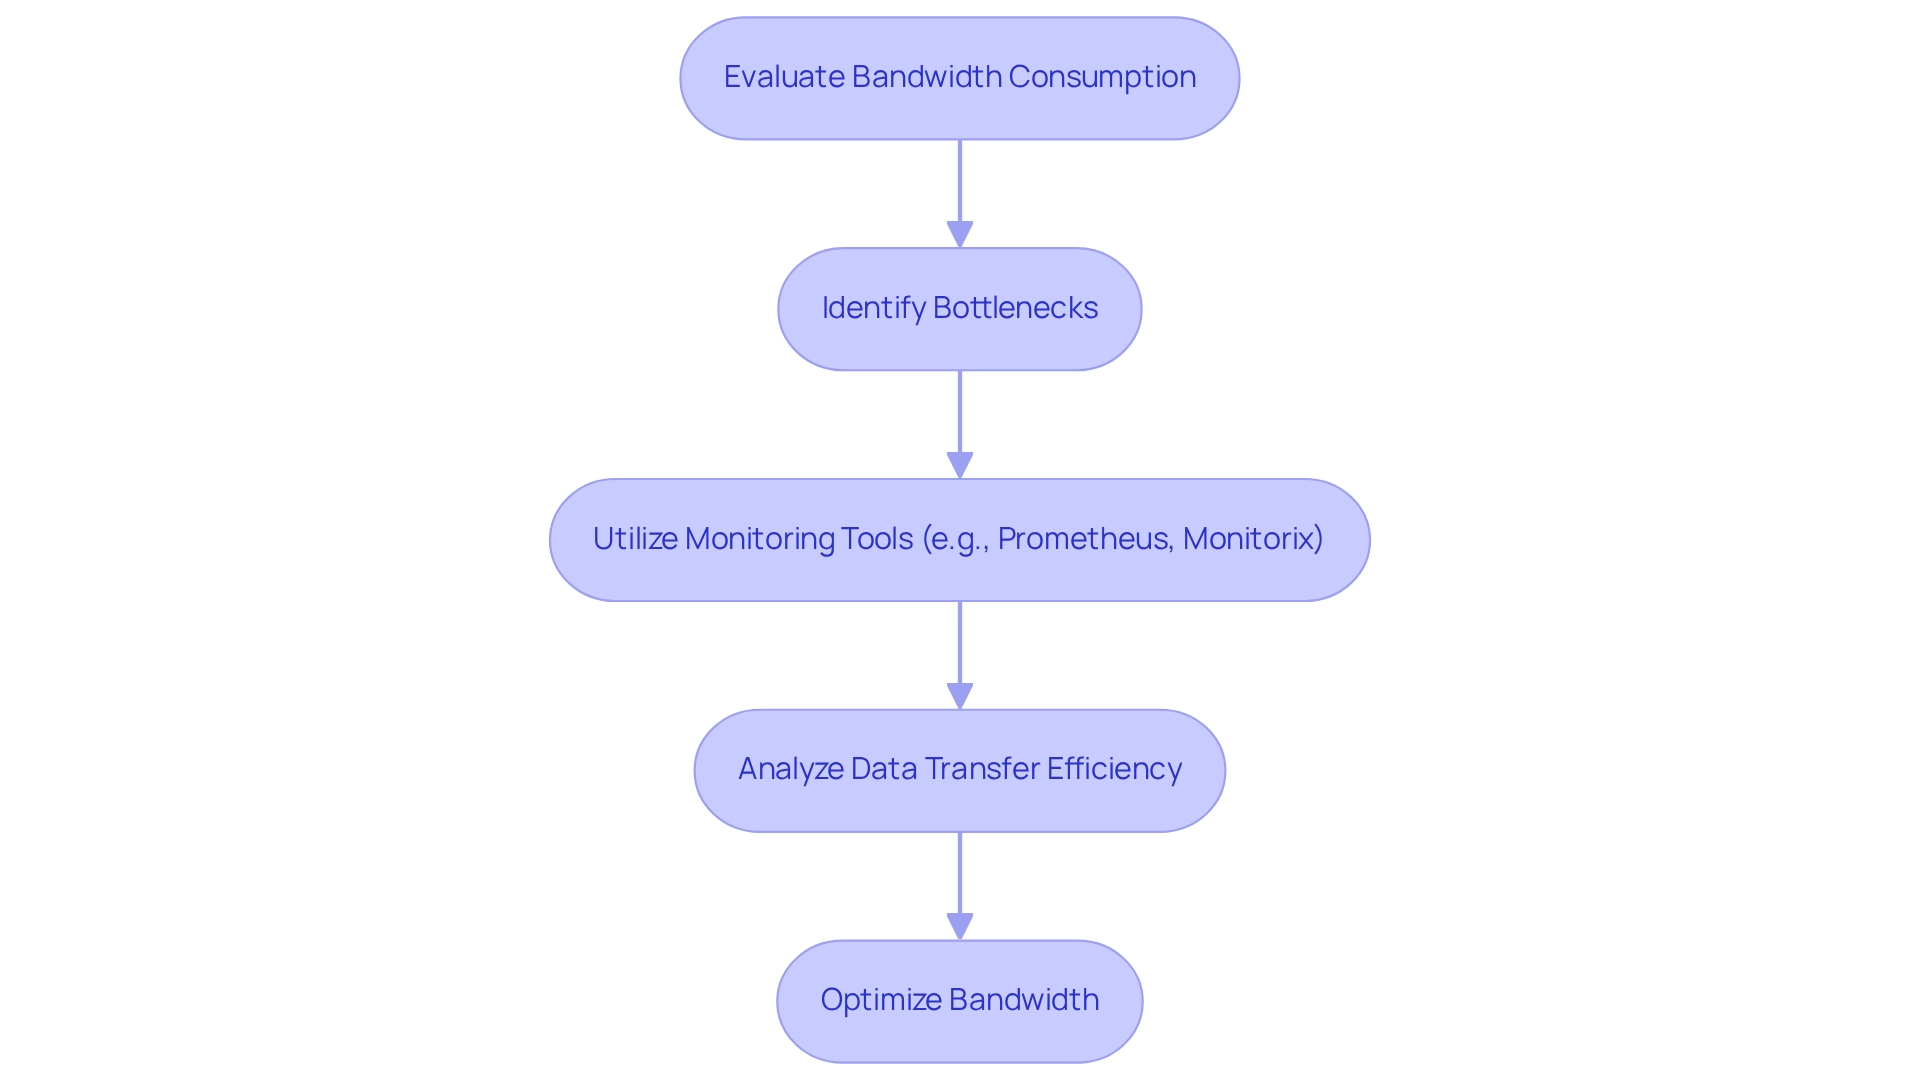
Network bandwidth quantifies the volume of data transmitted over a network within a specific timeframe. This makes its monitoring crucial for optimizing data transfer efficiency. Have you ever considered how often bandwidth consumption is evaluated? Frequent evaluations allow programmers to identify potential bottlenecks, ensuring systems can handle user requests smoothly, especially during high traffic times. In 2025, the significance of bandwidth in enhancing server performance metrics cannot be overstated; it directly impacts responsiveness and user experience.
For instance, tools like Prometheus with Grafana are highly regarded for monitoring Kubernetes clusters. They provide programmers with valuable insights into current bandwidth usage statistics for web services. Furthermore, case studies such as Monitorix demonstrate how effective monitoring using server performance metrics can enhance resource management and network visibility. Color-coded graphs track system resources and network traffic, making it easier to understand performance at a glance.
Expert insights also suggest that leveraging IP geolocation can optimize bandwidth. By routing traffic through the most efficient paths, latency is reduced, and data transfer speeds are improved. In addition, utilizing robust network bandwidth monitoring tools empowers developers to enhance application functionality and ensure efficient data transfer. Ultimately, this leads to a more responsive user experience.
Disk Usage: Manage Storage Resources Effectively
Disk usage is a critical aspect of system performance, referring to the amount of storage space being utilized. Monitoring disk usage is essential to prevent storage-related issues that can lead to downtime or degraded performance. Developers are encouraged to implement regular checks to manage disk space effectively, considering strategies like data archiving or cleanup to optimize storage resources.
In 2018 alone, the world generated a staggering 33 zettabytes of data, as reported by Statista. This statistic underscores the growing importance of effective disk usage management, especially in light of the increasing data generation. The SQL Server Disk I/O Usage report offers detailed statistics by disk, database, and file, which are vital for understanding usage patterns and identifying potential bottlenecks.
Experts emphasize the necessity of overseeing storage resources to avoid system downtime. For instance, automated notifications for low disk space can prompt programmers to take swift action before issues escalate. Additionally, case studies from the data storage sector indicate that organizations prioritizing disk usage management experience improved system efficiency and a reduced risk of outages. The future of the data storage industry appears promising, with ongoing innovations expected to reshape the landscape and cater to the needs of data-reliant sectors.
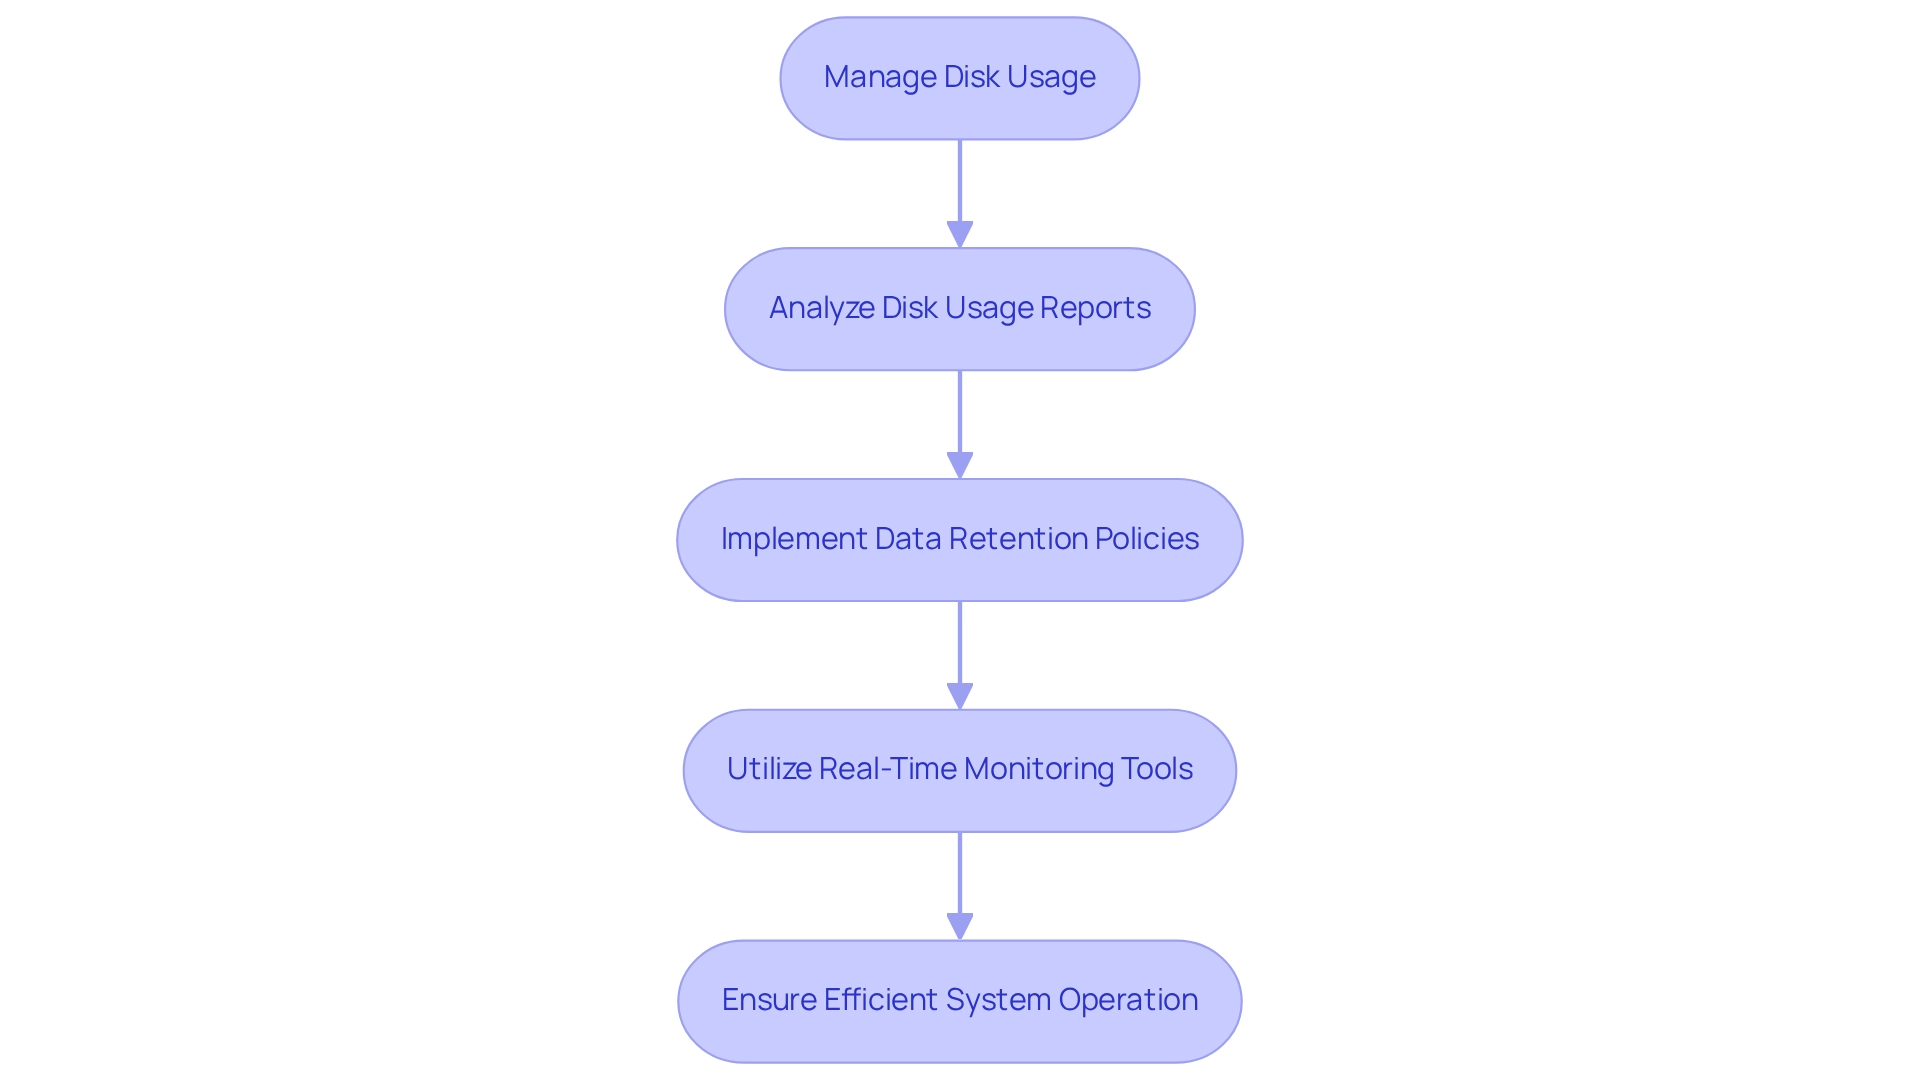
To manage disk usage effectively, developers can adopt several strategies:
- Regularly analyze disk usage reports to identify trends and anomalies.
- Implement data retention policies to archive or delete unnecessary files.
- Utilize tools that provide real-time monitoring and alerts for disk space thresholds.
By focusing on these approaches, developers can ensure their systems operate efficiently, ultimately leading to enhanced performance and reliability.
Thread Count: Optimize Concurrency Management
Thread count pertains to the quantity of threads that a system can handle simultaneously. Maximizing thread count is essential for ensuring that systems can manage numerous requests without a decline in efficiency. Consider the challenges developers face in maintaining performance under load—how can they optimize their systems effectively? As Theodore Levitt aptly stated, "Creativity is thinking up new things. Innovation is doing new things." This viewpoint emphasizes the creative strategy developers need to adopt in optimizing thread count for improved server efficiency.
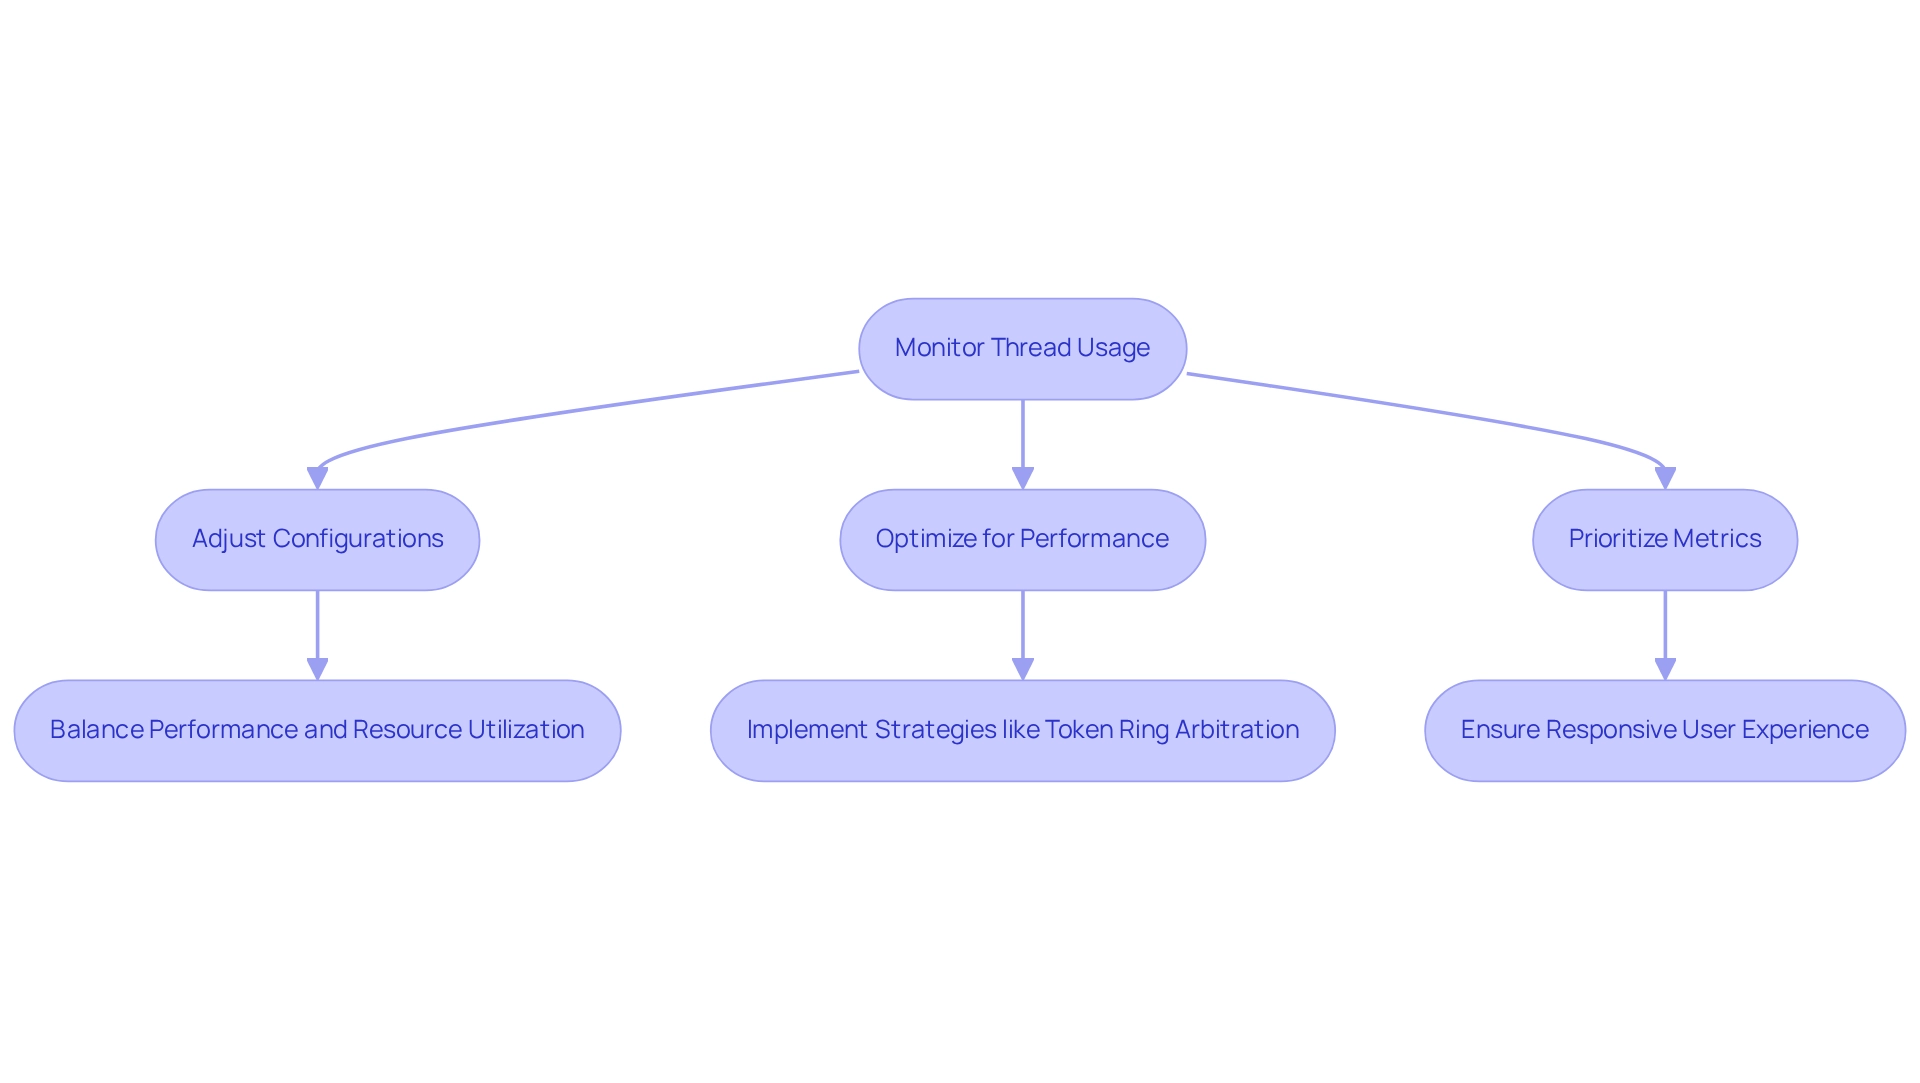
Furthermore, developers should monitor thread usage and adjust configurations to balance performance and resource utilization, ensuring that systems remain responsive under load. Effective thread management can significantly enhance system responsiveness, particularly during heavy load scenarios. For instance, the Token Ring Arbitration Scheme for on-chip CDMA bus architectures exemplifies effective thread management strategies. This design not only enhances data transfer latency but also resolves destination conflicts, achieving high throughput and low latency in multi-core systems. Isn’t it fascinating how optimizing thread count can lead to improved server concurrency?
In addition, overseeing concurrency in software is essential for ensuring optimal functionality. Developers are encouraged to prioritize thread count optimization as a key server performance metric in their performance testing strategies. By applying these insights, they can ensure that their applications scale effectively while delivering a responsive user experience. Are you ready to take your coding practices to the next level?
Conclusion
In today's fast-paced development environment, coding challenges are increasingly prevalent. Performance metrics are crucial in optimizing server efficiency and enhancing user experience. Tools like Kodezi not only automate the generation of OpenAPI specifications but also streamline essential processes such as documentation and code reviews. This allows developers to concentrate on refining their code, ultimately leading to improved uptime, average response time, and error rates—all vital for maintaining high server performance.
Furthermore, understanding and monitoring metrics such as peak response time, requests per second, and hardware utilization empower developers to identify potential bottlenecks and optimize resource allocation effectively. In addition, managing network bandwidth and disk usage is essential for ensuring seamless data transfer and preventing performance degradation. By implementing robust monitoring strategies and utilizing advanced tools, developers can proactively identify and resolve issues, enhancing server reliability and user satisfaction.
In a landscape where user demands are ever-increasing, adopting innovative solutions like Kodezi is no longer just an advantage but a necessity. As organizations strive for excellence in server performance, the combination of strategic metrics management and advanced tooling can elevate coding practices and ensure that applications deliver an outstanding user experience. Embracing these methodologies will not only drive productivity but also foster a culture of continuous improvement in server performance. What steps will you take to enhance your coding practices today?
Frequently Asked Questions
What challenges do developers face regarding coding practices and documentation?
Developers often struggle with maintaining efficient coding practices and documentation, which can hinder their productivity and system performance.
How does Kodezi help developers with documentation?
Kodezi simplifies the documentation process by automating the creation of OpenAPI specifications, allowing programmers to focus on improving their code and system efficiency.
What features does Kodezi offer to enhance coding practices?
Kodezi provides a comprehensive suite of developer tools, including automated code reviews, alignment of API documentation with code changes, automatic generation of OpenAPI 3.0 specifications, and hosting of Swagger UI sites for API testing.
How does Kodezi improve system monitoring?
Kodezi enables developers to monitor and enhance system performance by utilizing server performance metrics and providing quick alerts for system issues.
What is the significance of uptime in system availability?
Uptime indicates the percentage of time a system is operational and accessible, with a standard objective of 99.9% uptime to prevent user dissatisfaction and revenue loss due to outages.
How can Kodezi assist with uptime monitoring?
Kodezi automates uptime checks and quickly notifies programmers of any downtime incidents, helping to improve system reliability and ensure continuous availability.
Why is average response time important for user satisfaction?
Average response time measures how quickly a system responds to requests, with quicker response times linked to improved user satisfaction. Maintaining response times below 200 milliseconds is essential for a seamless user experience.
What methods can developers use to improve average response times?
Recommended methods include implementing effective caching strategies and reducing system load, which can be supported by Kodezi's AI-powered capabilities for automatic code correction and bug analysis.


