Overview
The article begins by addressing the significant coding challenges developers encounter, particularly in managing memory efficiently. It then highlights the importance of selecting the right memory leak detection tools in Java, showcasing how tools like Eclipse MAT, VisualVM, and YourKit can aid in this process.
By evaluating these tools based on criteria such as:
- Accuracy
- Performance impact
- Ease of use
the article guides developers to make informed choices that align with their project requirements. Ultimately, this selection not only enhances coding productivity but also contributes to effective resource management.
Introduction
In the realm of software development, memory management poses significant challenges that can profoundly impact an application's performance. Have you ever faced the frustration of memory leaks—those insidious issues that lead to slowdowns and unexpected crashes? Understanding how to effectively identify these leaks is crucial for developers striving to maintain optimal performance. This article explores the intricacies of memory leaks in Java, evaluates the criteria for detection tools, and provides a comparative analysis of top options available. By equipping developers with this knowledge, we aim to enhance your ability to tackle memory management challenges head-on.
Understanding Memory Leaks in Java
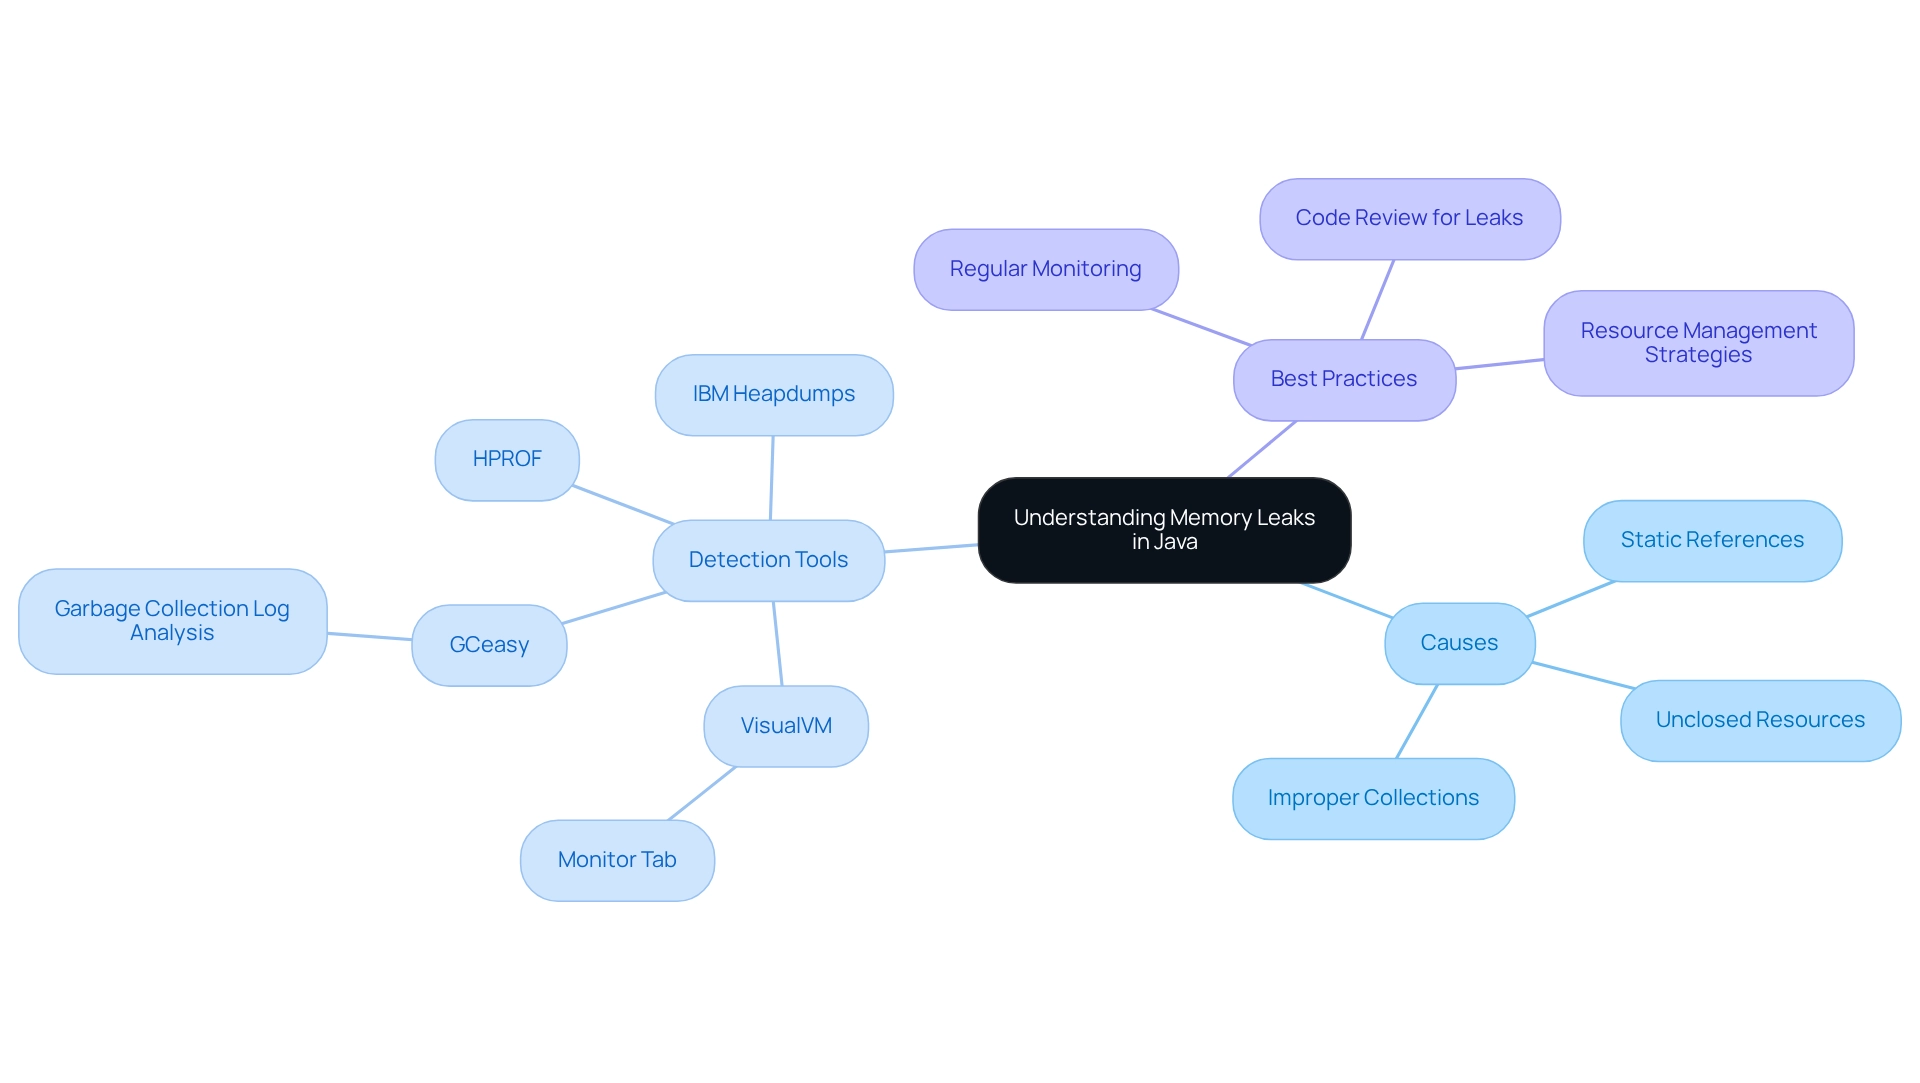
Developers often face significant challenges in managing memory in Java applications. An application may inadvertently hold onto references to objects that are no longer needed, which can hinder the garbage collector's ability to reclaim that space. This scenario can lead to increased resource usage, decreased performance, and even application failures due to OutOfMemoryError. Common culprits of data retention issues include:
- Static references
- Unclosed resources
- Improper use of collections
For example, static collections that grow indefinitely without being cleared can cause substantial memory retention. Furthermore, neglecting to close resources such as database connections or file streams can exacerbate these problems. Understanding these causes is crucial for developers to implement effective strategies for the prevention and detection of issues, particularly in the context of a memory leak in Java detection tool, as a thorough examination of the code utilizing the objects in question is essential to resolve resource wastage.
Recent studies underscore the importance of ongoing monitoring of resource usage. Tools like VisualVM act as a memory leak in Java detection tool by providing insights into resource usage over time, enabling programmers to identify trends that may indicate potential issues. Additionally, GCeasy can analyze garbage collection logs to pinpoint possible retention problems, acting as a memory leak in Java detection tool and offering a proactive approach to resource management. Other tools, such as HPROF and IBM Heapdumps for J2EE applications, provide developers with further options to assess resource utilization and identify issues, including the use of a memory leak in Java detection tool, thereby enhancing their ability to maintain application performance.
Practical examples illustrate the impact of resource mismanagement on application performance. In one case study, a Java application experienced significant slowdowns due to a leak caused by unclosed database connections, resulting in a 50% increase in response time. This case highlights the critical need for programmers to adopt best practices in resource management.
Expert insights suggest that regular occurrences of garbage collection may indicate impending resource issues, reinforcing the necessity for developers to remain vigilant. By understanding the causes and effects of resource depletion, developers can better equip themselves to sustain application performance and reliability.

Criteria for Evaluating Detection Tools
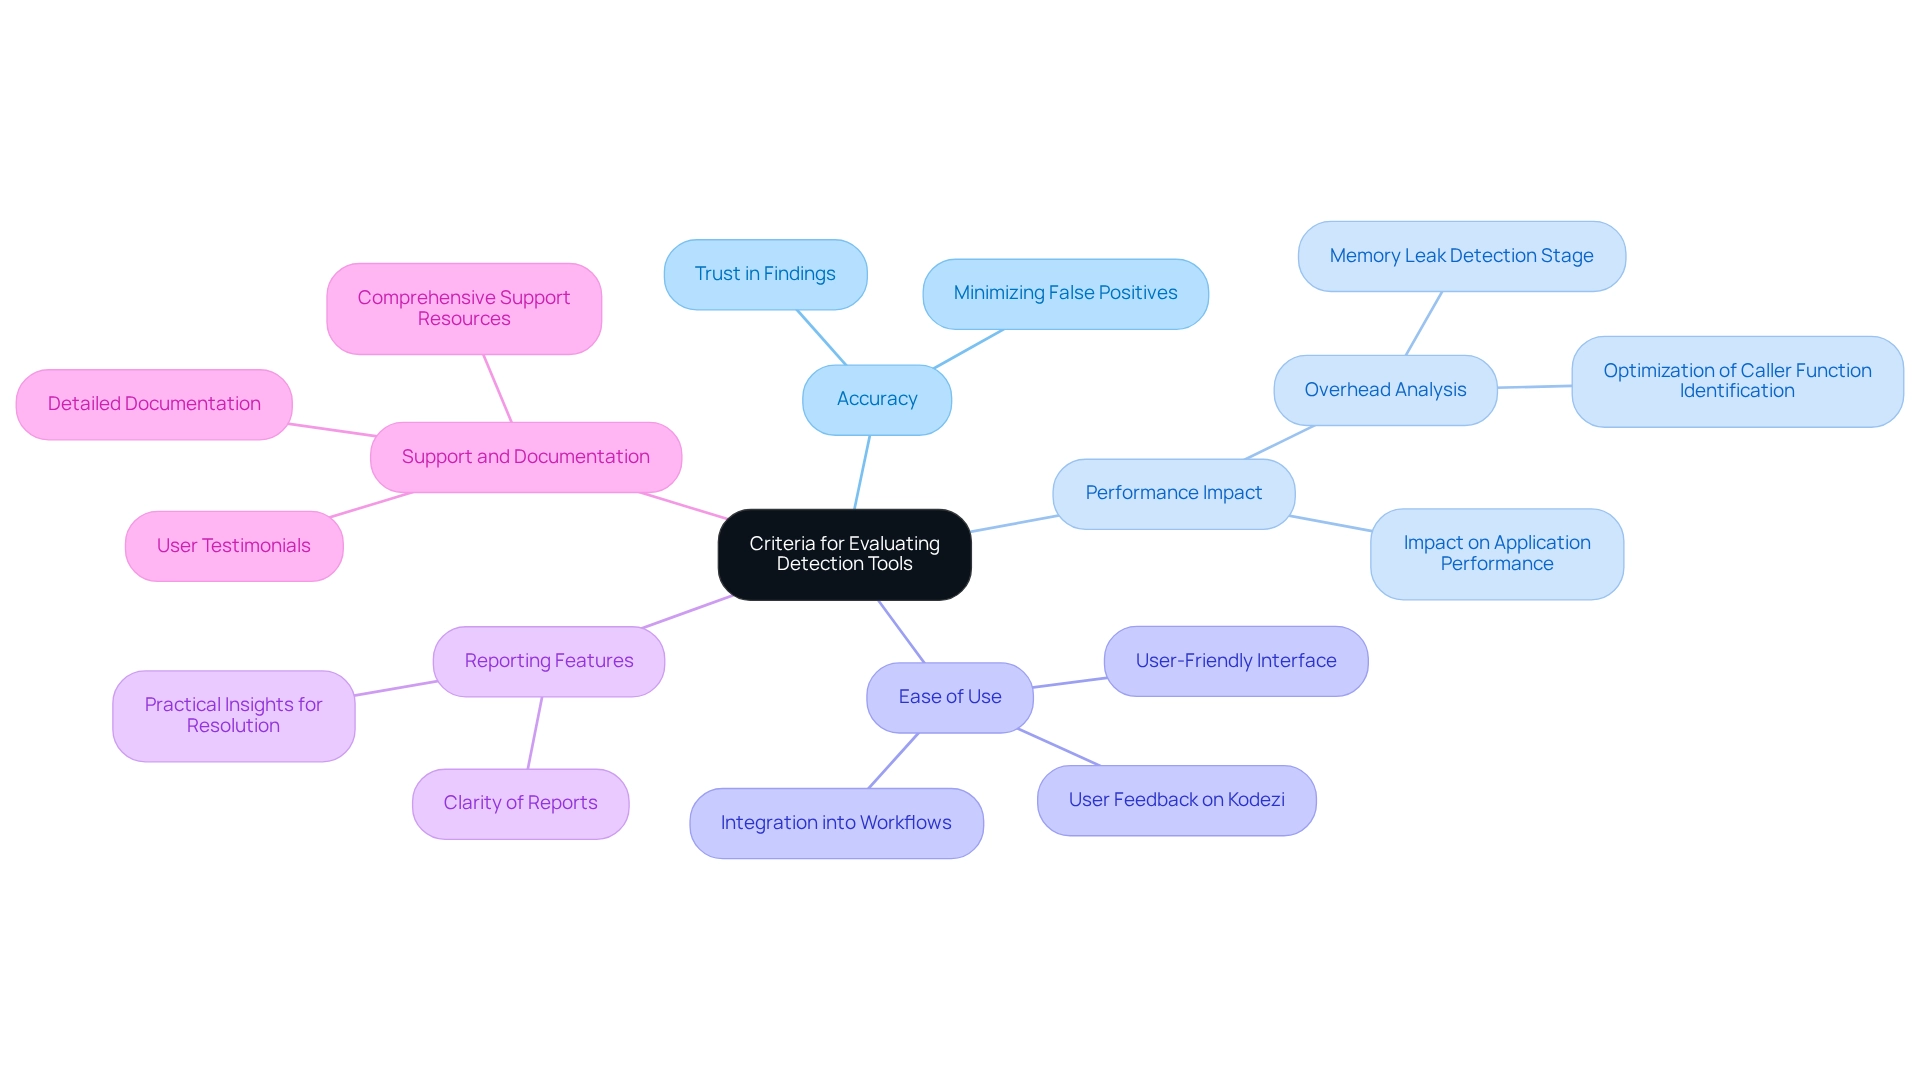
In the world of software development, memory leaks can pose significant challenges for developers, complicating the coding process and impacting application performance. To effectively combat these issues, a memory leak in Java detection tool must meet several critical criteria.
Accuracy stands out as a vital factor. The tool's ability to precisely identify memory leaks while minimizing false positives is essential. High accuracy in the memory leak in Java detection tool ensures that developers can trust its findings, which is crucial for maintaining code quality.
Performance Impact is another key consideration. Evaluating how the tool influences application performance during analysis is crucial. Tools that introduce minimal overhead allow for smoother development processes. For instance, a recent performance overhead analysis revealed that the memory leak detection stage accounted for 78.53% of the total runtime, underscoring the importance of optimizing this phase to reduce impact.
Ease of Use cannot be overlooked. A user-friendly interface and seamless integration into existing workflows can significantly enhance productivity. Tools that are intuitive and require minimal setup time are favored by programmers. Kodezi exemplifies this with its user-friendly features, praised by users for transforming debugging into a process that feels like "unlocking a new superpower." This ease of use enables programmers to concentrate on higher-level tasks rather than getting bogged down in debugging.
Reporting Features also play a crucial role. The clarity and quality of reports produced by the software are vital. Effective reporting should provide practical insights that assist programmers in understanding the characteristics of the issues and how to resolve them.
Support and Documentation are essential for assisting users in troubleshooting and interpreting results. Comprehensive support and detailed documentation enhance the user experience and effectiveness. Kodezi has received positive feedback for its robust support resources, which help users navigate the system effectively.
Pros of Kodezi:
- User-friendly interface that enhances productivity.
- Positive testimonials highlighting significant improvements in debugging efficiency.
Cons of Kodezi:
- Some users may require more detailed documentation for complex issues.
By assessing these standards, programmers can select the most appropriate memory leak in Java detection tool that aligns with their needs and boosts their coding productivity. As Michael Lopp aptly stated, "A software metaphor is more like a searchlight than a road map. It doesn’t tell you where to find the answer; it tells you how to look for it." This perspective emphasizes the importance of evaluating resources not just for their attributes, but for how they assist programmers in their tasks.

Comparative Analysis of Top Detection Tools
In the realm of software development, managing a memory leak in Java detection tool poses significant challenges for developers. Here is a comparative analysis of three popular memory leak detection tools:
-
Tool Name: Eclipse MAT
- Accuracy: High
- Performance Impact: Low
- Ease of Use: Moderate
- Reporting Features: Detailed reports
- Support: Good
-
Tool Name: VisualVM
- Accuracy: Moderate
- Performance Impact: Moderate
- Ease of Use: High
- Reporting Features: Basic reports
- Support: Excellent
-
Tool Name: YourKit
- Accuracy: High
- Performance Impact: Low
- Ease of Use: High
- Reporting Features: Comprehensive reports
- Support: Good
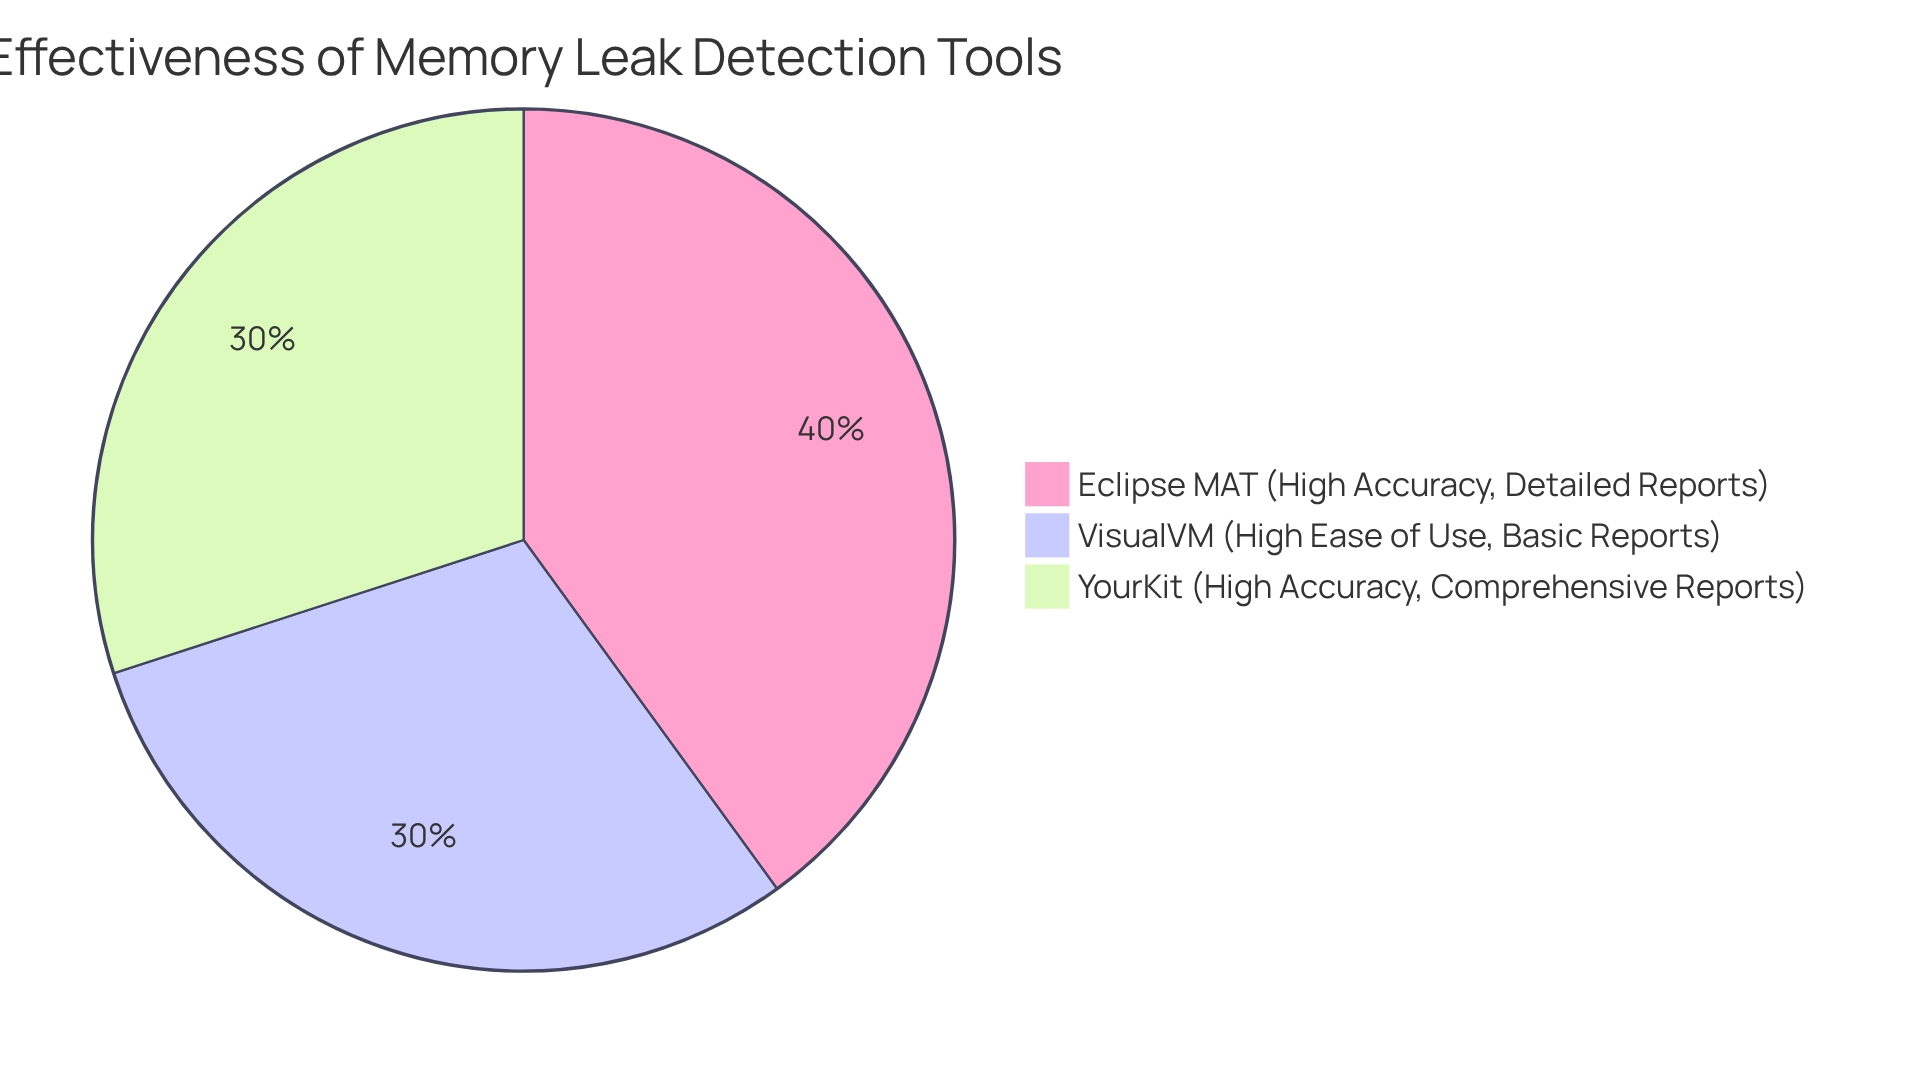
Eclipse MAT is recognized for its high accuracy and detailed reporting, making it suitable for in-depth analysis. However, it may require a steeper learning curve. It is advised for all Java programmers to assist in identifying resource issues and related difficulties. As Ian Bull, an Eclipse contributor, stated, "The Eclipse Memory Analyzer is a powerful tool, one all Java programmers should be acquainted with." This recommendation underscores its effectiveness in addressing the major challenges related to the memory leak in Java detection tool within software engineering.
VisualVM offers a user-friendly interface and is easy to integrate, appealing to those who prioritize simplicity. However, its reporting features are less comprehensive, which may not fully meet the needs of complex projects. How does one balance ease of use with the depth of analysis required?
YourKit combines high precision with outstanding reporting features, making it a favorite among programmers despite its cost. Its comprehensive reports provide valuable insights into resource usage, assisting developers in optimizing their applications efficiently. What if the right tool could significantly enhance your productivity?
In summary, while Eclipse MAT excels in accuracy and detail, VisualVM offers ease of use, and YourKit balances performance with comprehensive reporting. Each tool serves distinct needs within the software development landscape, highlighting the importance of selecting the appropriate resource based on specific project requirements. Considering the intricacy and variety of resource issues, employing efficient tools such as the memory leak in Java detection tool Eclipse MAT is essential for maintaining high standards in code quality.

Choosing the Right Tool for Your Needs
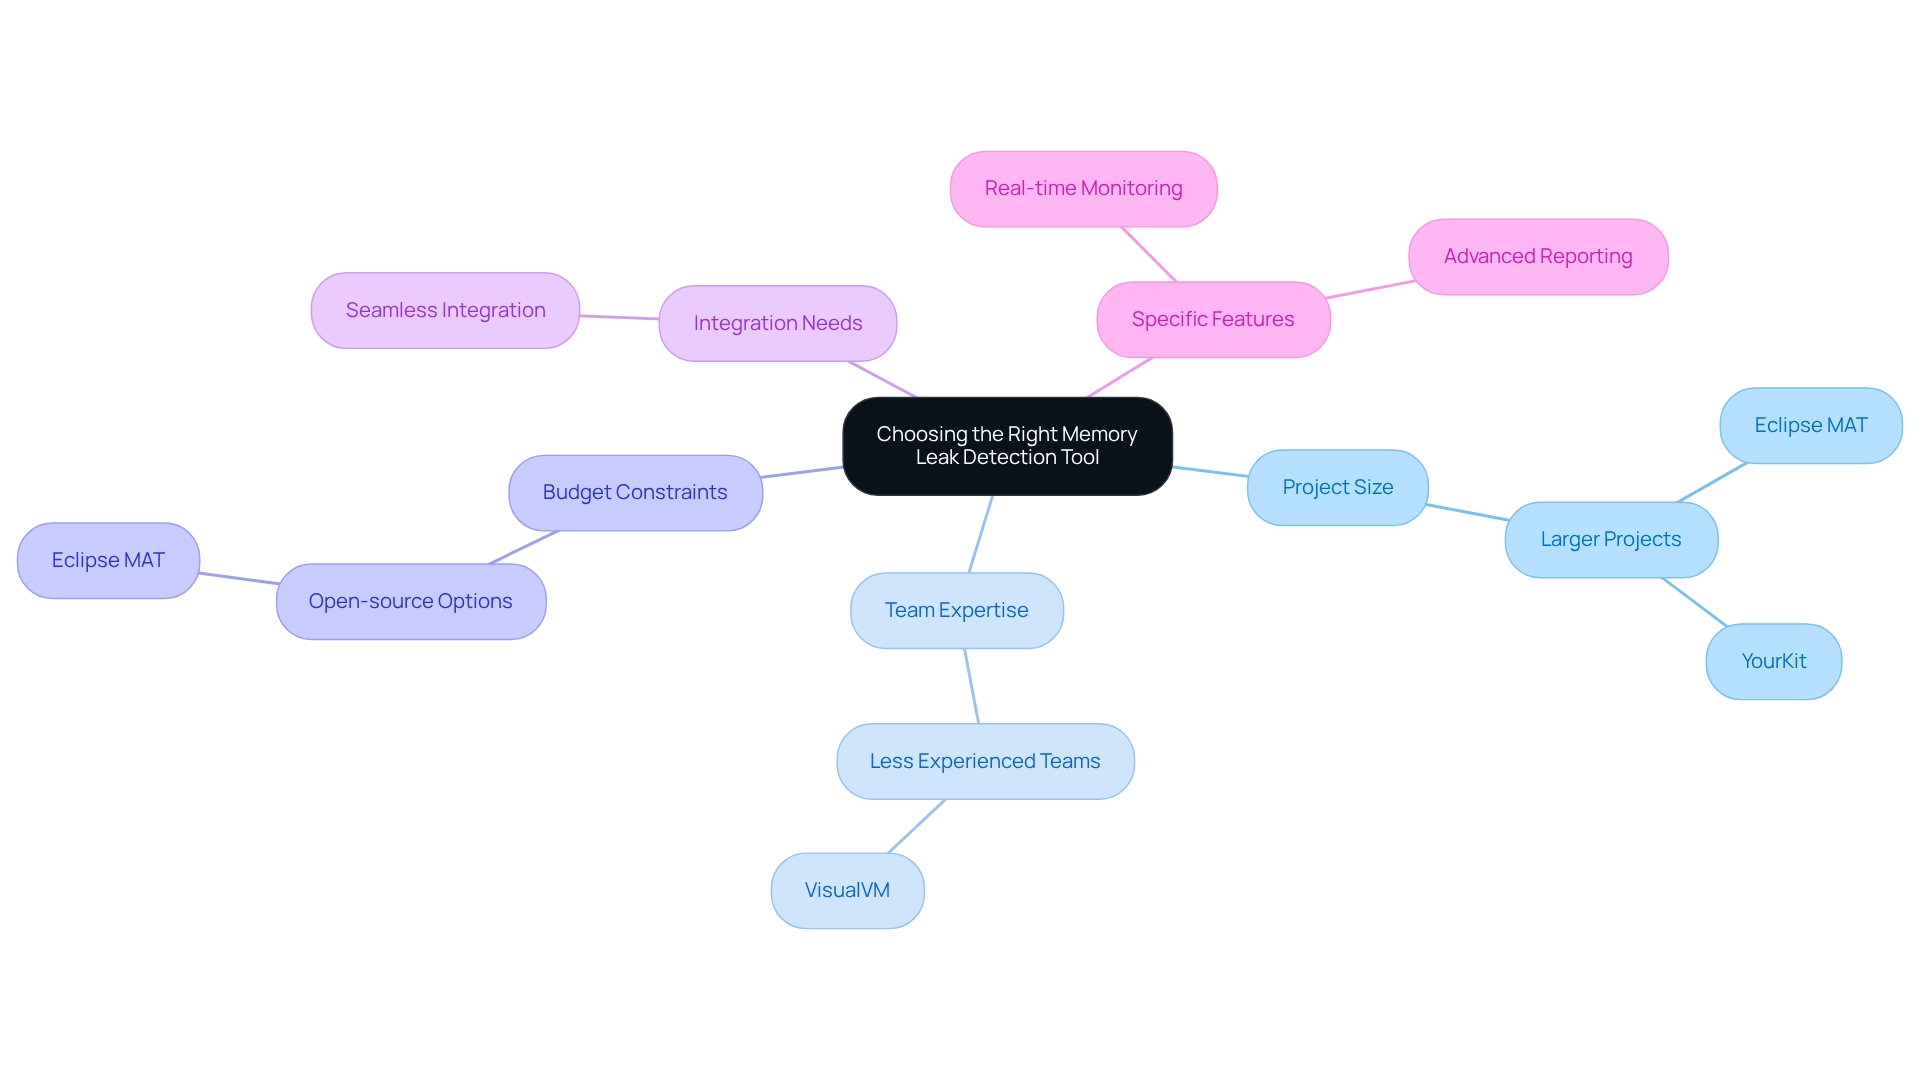
Choosing the right memory leak in Java detection tool is crucial for developers facing coding challenges. Factors to consider include:
- Project Size: For larger projects, resources such as Eclipse MAT or YourKit may be more suitable due to their comprehensive analysis capabilities.
- Team Expertise: If the team is less experienced, a resource with a user-friendly interface like VisualVM may be preferable.
- Budget Constraints: Consider the expense of the instrument versus the budget available for development resources. Open-source options like Eclipse MAT can be beneficial for teams with limited budgets.
- Integration Needs: Ensure the software can integrate seamlessly with existing development environments and workflows to minimize disruption.
- Specific Features: Identify any specific features that are critical for your project, such as real-time monitoring or advanced reporting capabilities.
As Brian Cooke wisely expressed, "A united team with the appropriate resources is unbeatable," emphasizing the significance of cooperation in resource selection. Furthermore, with more than 650,000 classification experiments in the database, the efficacy of these resources can be quantitatively validated.
In this context, utilizing tools like Kodezi can significantly enhance developer productivity by automatically analyzing bugs and optimizing code. Have you considered how Kodezi can help your team address challenges related to the memory leak in Java detection tool? By leveraging its features, teams can improve their coding practices, ensuring they are well-equipped to enhance productivity and code quality. Explore the tools available on the platform to see how they can benefit your development efforts.

Conclusion
Memory management poses a significant challenge for developers, particularly in the context of identifying and mitigating memory leaks in Java applications. This article has explored the nature of memory leaks, emphasizing their causes—such as static references and unclosed resources—that can lead to performance degradation and application crashes. By grasping these issues, developers can implement effective strategies for prevention and detection.
Evaluating memory leak detection tools is crucial for maintaining optimal application performance. Key criteria—accuracy, performance impact, ease of use, reporting features, and support—are essential considerations that can greatly influence a developer's choice of tool. A comparative analysis of popular options like Eclipse MAT, VisualVM, and YourKit reveals that each tool presents unique advantages tailored to varying project needs.
Ultimately, the selection of a memory leak detection tool should be guided by factors such as project size, team expertise, budget constraints, integration needs, and specific feature requirements. By choosing the right tool and adopting best practices in memory management, developers can improve their capacity to address memory leaks effectively, ensuring robust application performance and reliability. In an era where application efficiency is paramount, this understanding empowers developers to write cleaner, more efficient code, paving the way for successful software development.
Frequently Asked Questions
What challenges do developers face in managing memory in Java applications?
Developers often struggle with managing memory due to inadvertent retention of references to objects that are no longer needed, which can hinder the garbage collector's ability to reclaim that space. This can lead to increased resource usage, decreased performance, and potential application failures, such as OutOfMemoryError.
What are common causes of memory retention issues in Java?
Common culprits of memory retention issues include static references, unclosed resources, and improper use of collections. For example, static collections that grow indefinitely without being cleared can cause significant memory retention, and neglecting to close resources like database connections or file streams can worsen these problems.
How can developers detect memory leaks in Java applications?
Developers can use memory leak detection tools such as VisualVM, which provides insights into resource usage over time, and GCeasy, which analyzes garbage collection logs to identify retention problems. Other options include HPROF and IBM Heapdumps for J2EE applications, which help assess resource utilization and identify issues.
Can you provide an example of the impact of resource mismanagement on application performance?
In one case study, a Java application experienced significant slowdowns due to a memory leak caused by unclosed database connections, resulting in a 50% increase in response time. This illustrates the critical need for best practices in resource management.
What do expert insights suggest regarding garbage collection and resource issues?
Experts suggest that frequent occurrences of garbage collection may indicate impending resource issues, highlighting the importance for developers to remain vigilant and understand the causes and effects of resource depletion to maintain application performance and reliability.


