Introduction
Flowcharts are indispensable tools in software development, providing a visual representation that simplifies complex coding processes. By illustrating the sequence of operations and the relationships between components, flowcharts enhance the understanding of code logic and decision-making. They foster better communication among team members, streamline the coding workflow, and are crucial for effective technical onboarding.
This article delves into the essential steps and best practices for creating effective flowcharts, ensuring clarity, consistency, and efficiency in the development process. From selecting the right symbols to designing a logical flow, discover how to leverage flowcharts to maximize productivity and achieve successful project execution.
Understanding the Purpose of a Flowchart
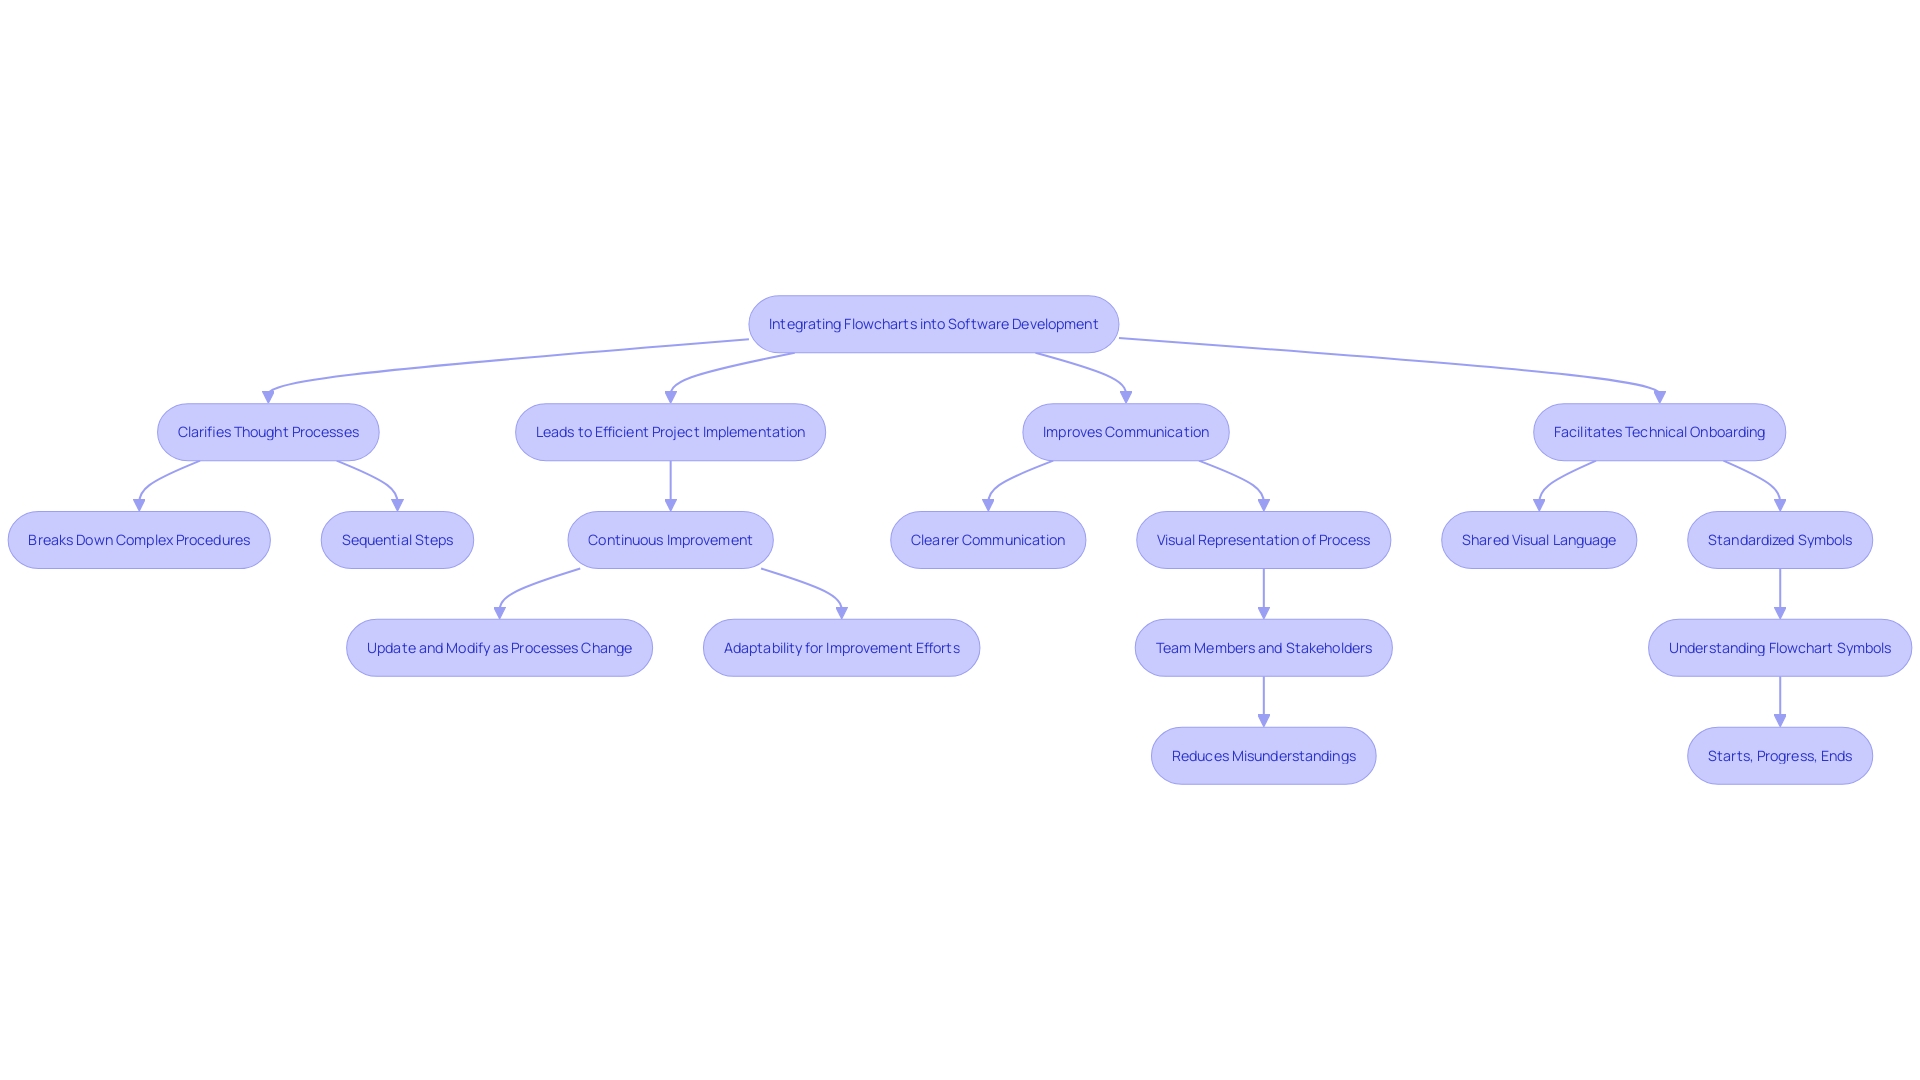
Flowcharts are vital instruments in software development, providing a visual depiction of workflows that enable coders to observe the flow of logic and decision-making within their code. These diagrams simplify complex coding structures, making it easier to understand the sequence of operations and the relationships between various components. As noted in the development of a Scholarly Research Management Website, visualizing the intricate interplay of components is crucial for managing scholarly research, professors, and study subjects effectively.
By clarifying thought processes, visual diagrams enhance communication among team members, fostering a shared understanding and streamlining the coding workflow. This shared language is invaluable, as it transforms abstract concepts into tangible solutions, allowing developers to conceptualize, communicate, and refine their ideas effectively.
Moreover, diagrams play a pivotal role in technical onboarding. Studies have shown that software professionals spend a significant portion of their work hours understanding existing systems. Efficient application of software visualization instruments, such as diagrams, can greatly decrease the time needed for newcomers to become productive, improving overall efficiency.
Integrating diagrams into the coding workflow not only enhances teamwork but also guarantees that all team members are aligned, which is crucial for the successful implementation of any project. By offering a clear, visual guide, diagrams clarify the path ahead, enhancing the development journey to be more efficient and effective.
Identifying the Process or Task to Flowchart
To create an effective diagram, start by clearly defining the process or task you want to visualize. Decompose the coding project into its essential elements, recognizing the crucial phases, choices, and results involved. This preliminary action guarantees that your diagram correctly represents the programming logic and assists in problem-solving and enhancement.
Next, review the diagram for clarity. Review it to confirm that each phase is clearly depicted and easy to follow. This involves verifying the diagram icons, the sequence of actions, and the general layout. Then, share the diagram with colleagues or those familiar with the process to collect feedback. Their insights can reveal areas that might need more clarification or simplification.
Based on the feedback, make necessary adjustments. This might entail rearranging steps, enhancing the use of graphical representations, or simplifying intricate sections of the diagram. Furthermore, make sure that every element of the diagram is uniform regarding icons, language, and arrangement. This repetitive method of assessment and enhancement is essential for developing a productive and efficient diagram.
Choosing the Right Flowchart Symbols
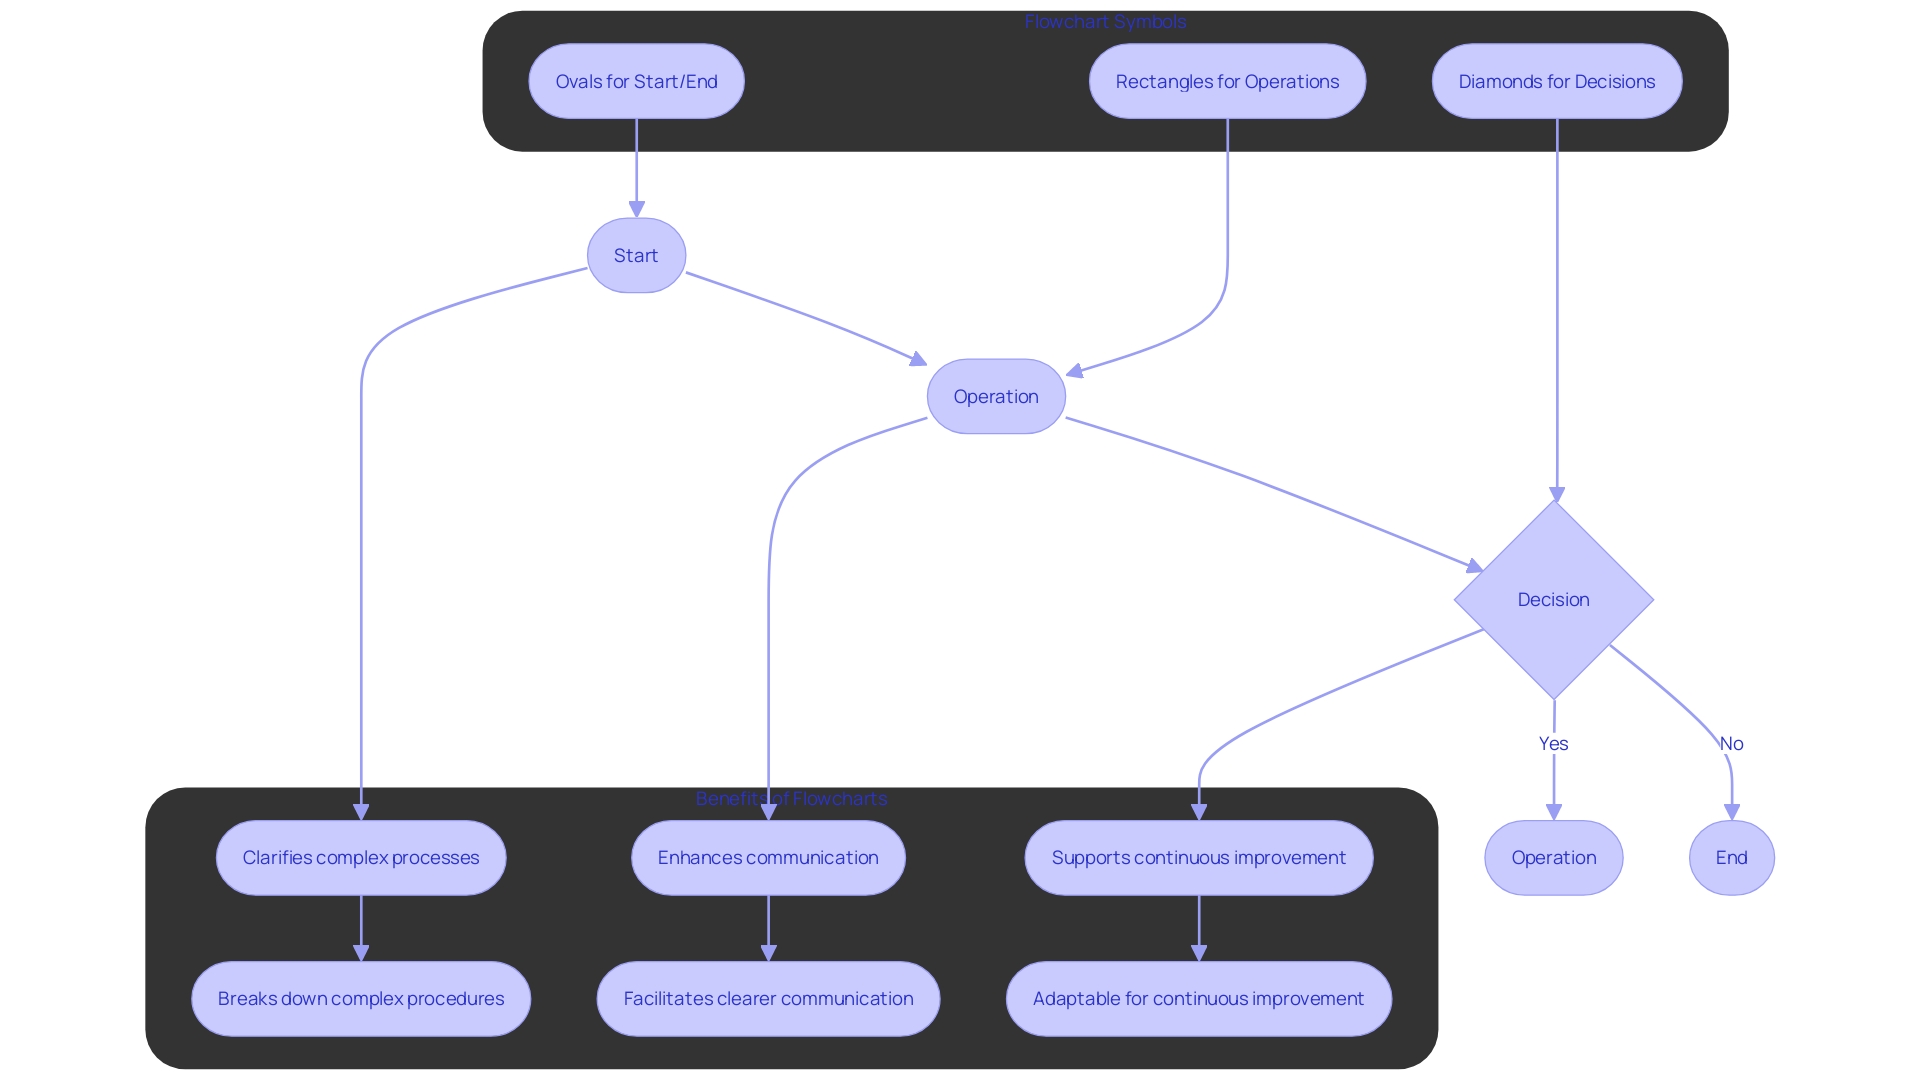
Choosing suitable representations is essential for efficient diagram creation. Different diagram types serve distinct purposes, such as procedural charts for outlining stages in business operations or workflow diagrams for monitoring task movements. Typical shapes consist of ovals (or terminal shapes) for beginning and ending points, rectangles for operations, diamonds for choices, and arrows to show flow direction. The oval design, also referred to as the terminal sign, visually indicates the beginning or conclusion of a process diagram and aids in clearly conveying the entry and exit locations. Rectangles, the shape indicators, are crucial for outlining particular tasks or actions within a workflow, facilitating the tracking and examination of individual tasks. By familiarizing yourself with these symbols, you ensure clarity and consistency in your diagram, making it accessible to all stakeholders. This approach enhances the efficiency of the development cycle, as visual representations of system architectures, flowcharts, and data models provide a shared language for conceptualizing, communicating, and refining ideas.
Designing a Flowchart: Key Principles
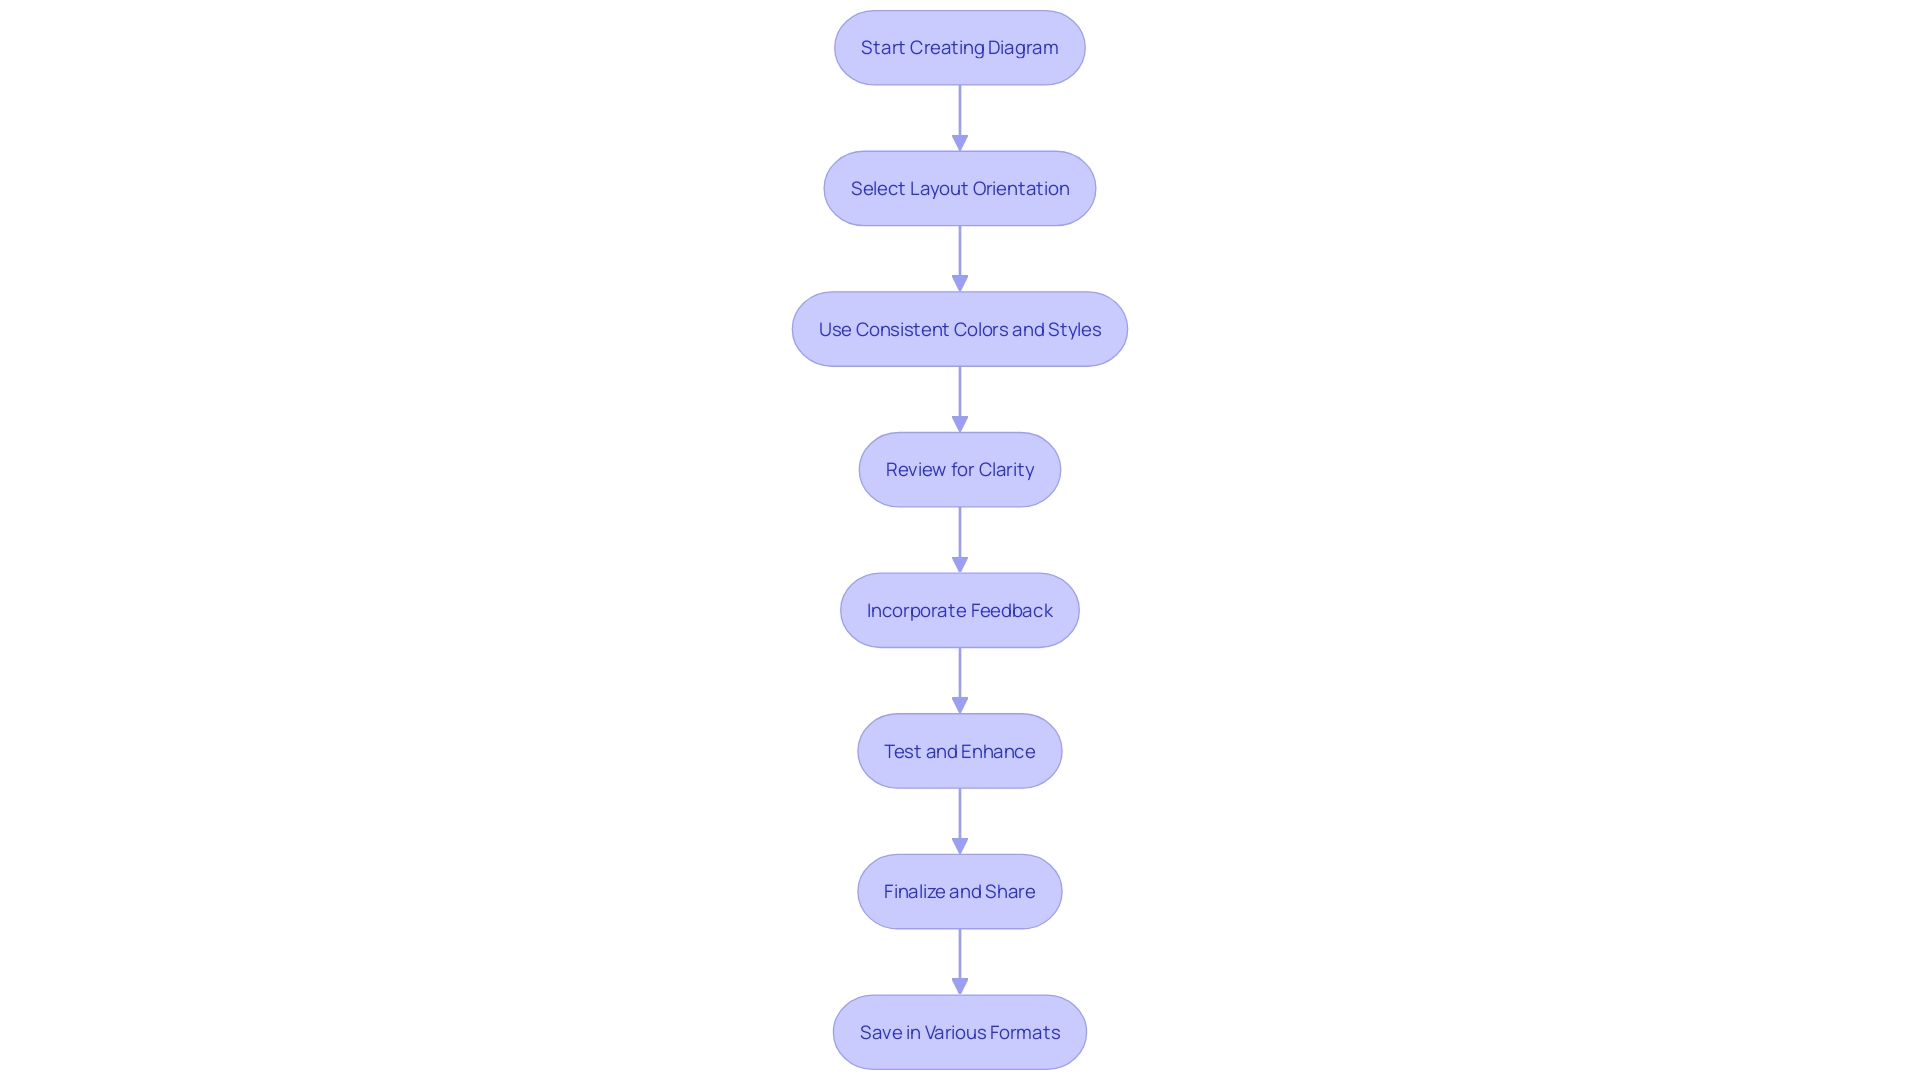
When creating your diagram, it is essential to adhere to principles such as simplicity, clarity, and logical flow. A flowchart is a diagram that employs shapes and arrows to illustrate a workflow, enabling the representation of intricate procedures through a common visual language. By maintaining a clean layout with sufficient spacing between symbols, you can avoid clutter and ensure each phase is clearly represented and easy to follow.
Use a top-to-bottom or left-to-right orientation to guide the viewer’s eye naturally through the process. Consistent use of colors and styles can significantly enhance readability. Flowcharts, often referred to as flow diagrams, are a useful method to create and record each stage in a workflow and demonstrate how they are linked. Reviewing for clarity, sharing the diagram with colleagues, and collecting feedback can reveal areas that might need more clarification or simplification. According to this feedback, you can make necessary adjustments, such as rearranging steps, refining the use of diagram symbols, or simplifying complex parts of the diagram.
Researchers highlight the significance of clarity in data visual representations, and diagrams are no exception. Our instrument, which consists of 11 items across 4 dimensions—understandability, layout clarity, readability of data values, and readability of data patterns—can complement results from controlled experiments on user task performance. This rigorous approach ensures that your flowcharts are not only functional but also accessible and easy to understand for all users.
Step-by-Step Guide to Creating a Flowchart
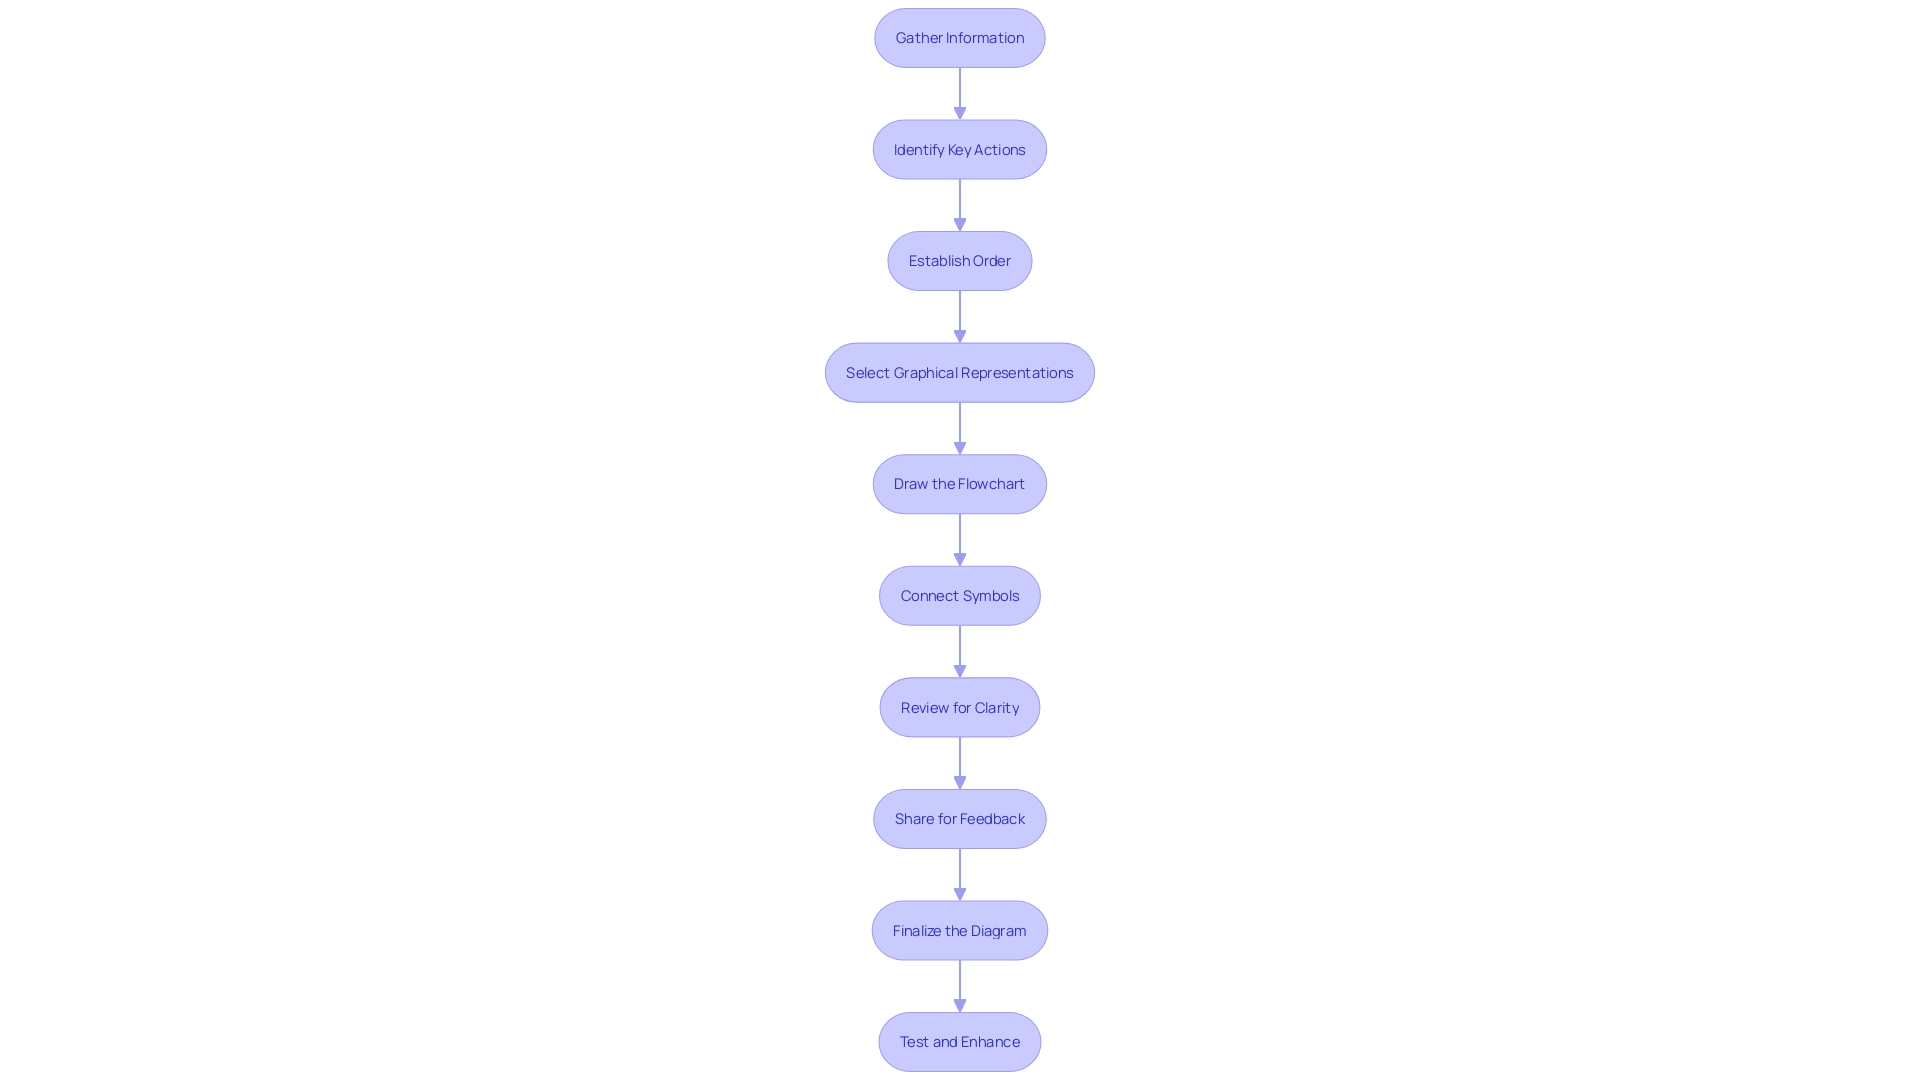
- Start by gathering all relevant information about the coding procedure. This involves understanding the overall objective, the specific tasks, and any constraints or requirements.
- Identify the key stages involved in completing the task. Break down the procedure into clear, manageable actions that can be easily visualized.
- Establish the order of these actions and how they relate to each other. This guarantees that the diagram correctly illustrates the procedure from beginning to end.
- Choose suitable signs according to the steps outlined. Common graphical representations such as rectangles for processes, diamonds for decisions, and arrows for direction of movement are crucial.
- Begin drawing your flowchart, arranging icons in the proper sequence to represent the order of operations. Ensure each phase is represented clearly and logically.
- Use arrows to connect the symbols, indicating the flow of the process. This visual connection aids in comprehending the progression and dependencies between stages.
- Review and refine your flowchart for accuracy and clarity. Examine each step to ensure it is clearly represented and easy to follow. Gather input from coworkers or individuals knowledgeable about the procedure to pinpoint aspects requiring clarification or simplification. Make iterative improvements based on this feedback to enhance the diagram's effectiveness.
Tips for Effective Flowchart Design
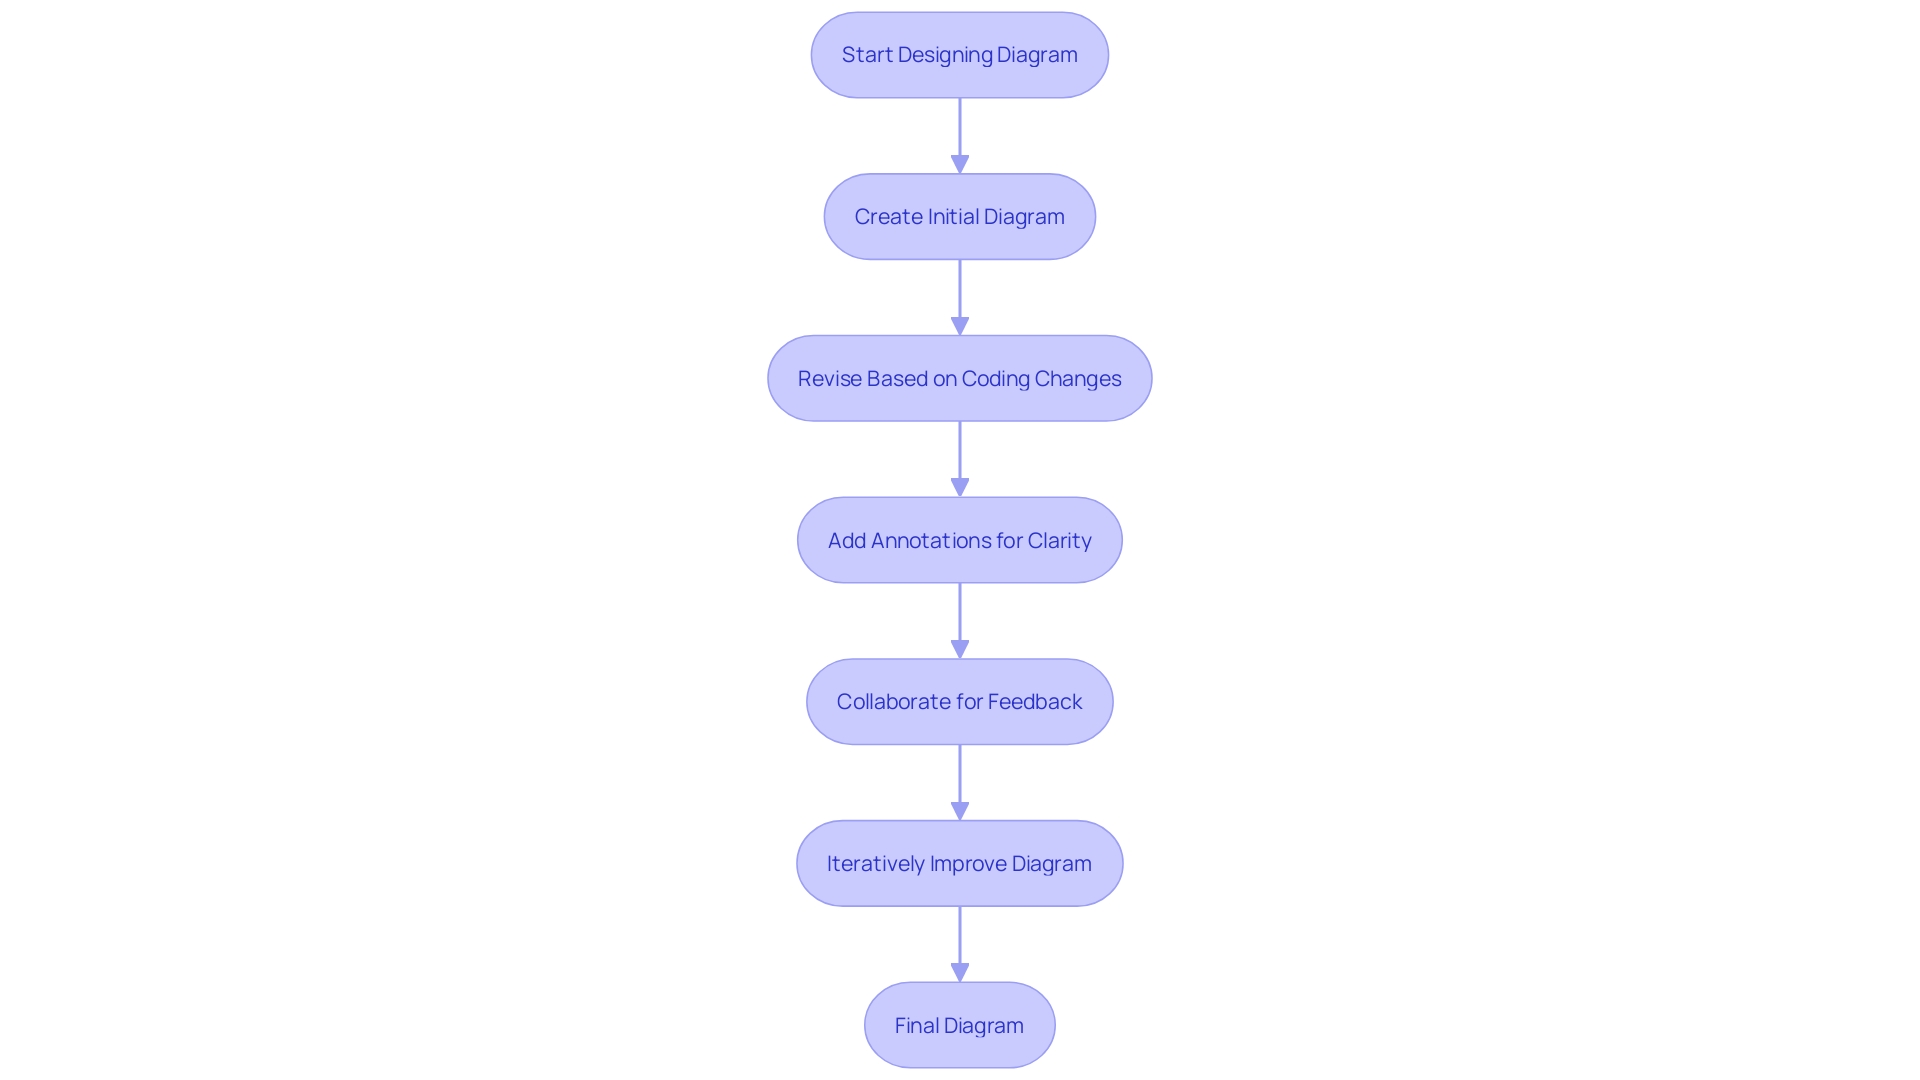
To design an easy-to-use diagram, begin by making sure it is brief and centered on the main operation. Consistently revise the diagram to represent any alterations in the coding procedure. Annotations or notes can be added to clarify complex steps, enhancing overall readability. Collaborate with team members to gather feedback and make iterative improvements. By sharing the diagram with colleagues, you can identify areas that require further simplification or clarification, ensuring the diagram accurately represents the process and is easy to understand.
Best Practices for Flowchart Creation
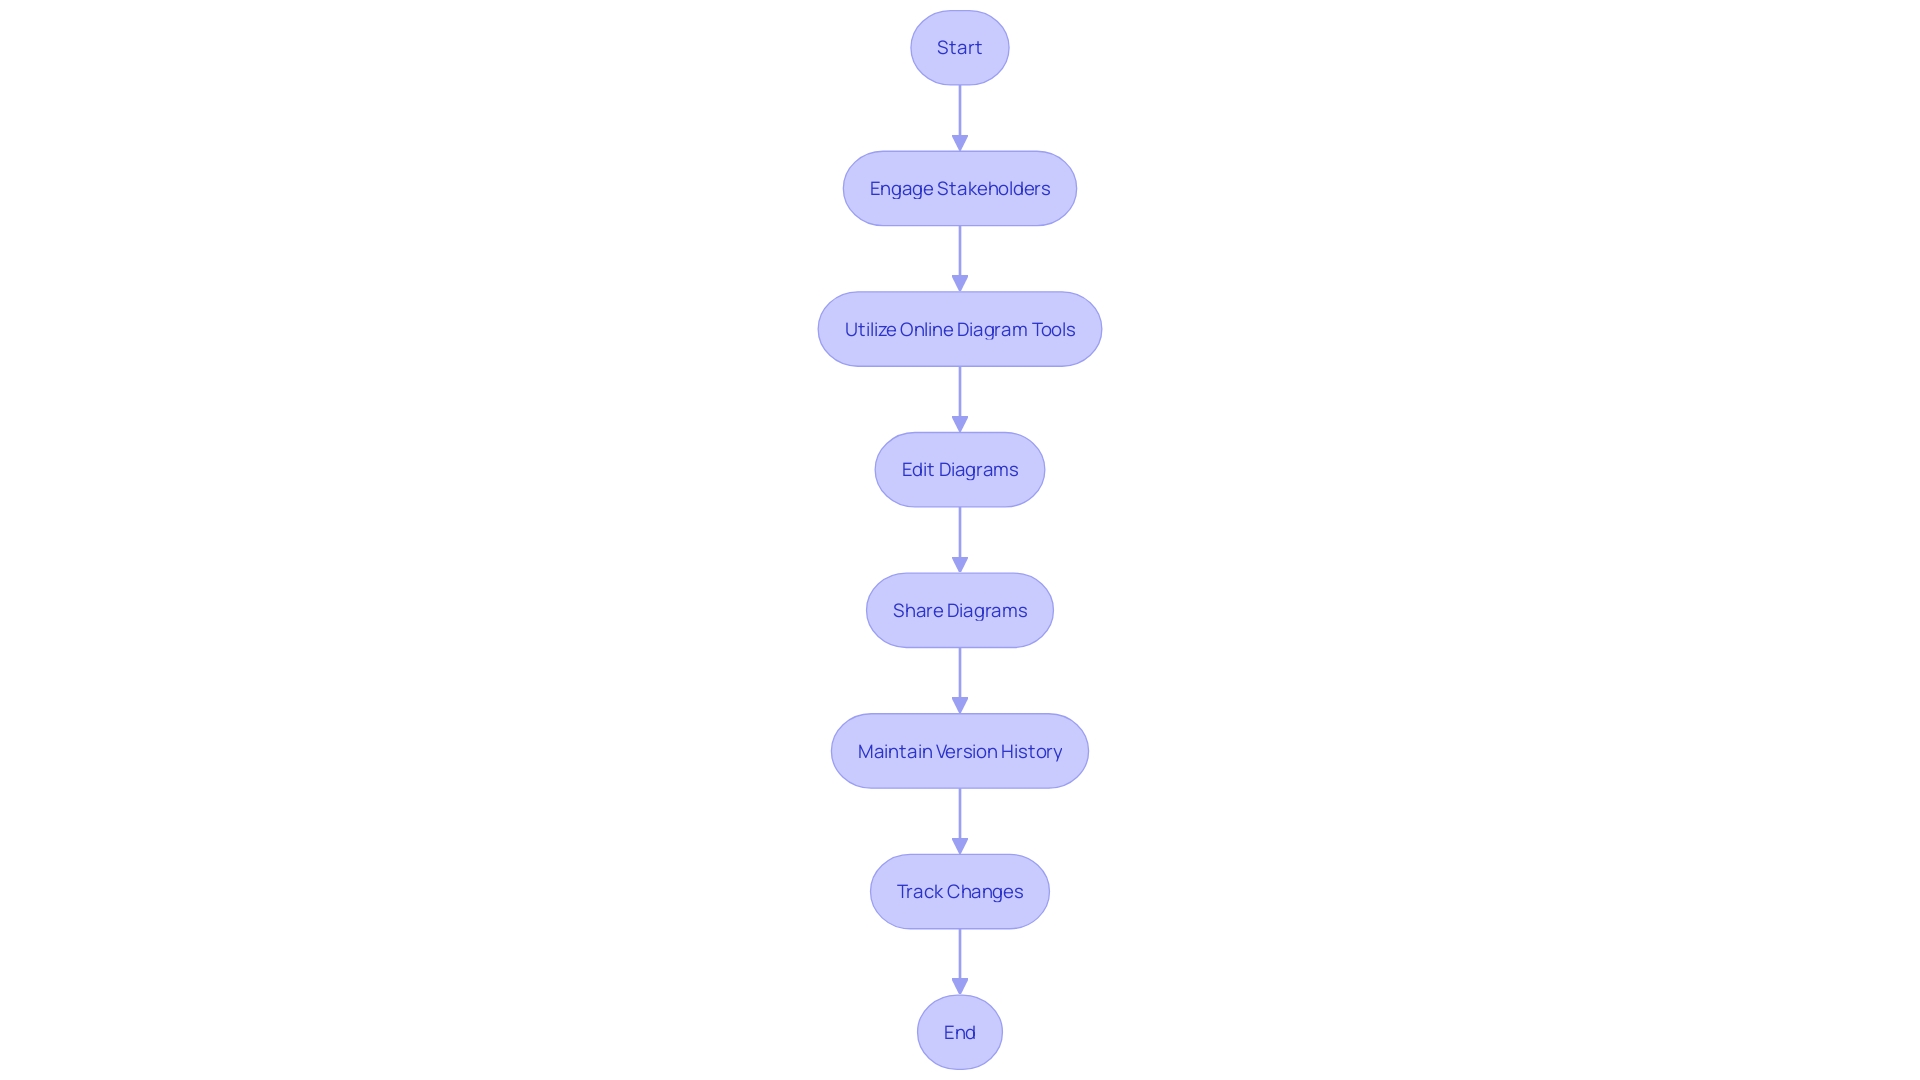
To ensure the effectiveness and accuracy of your diagrams, it's crucial to validate them with stakeholders. This step confirms that all user interactions and system behaviors are correctly documented, and functional requirements are met. Utilizing online diagram tools can greatly improve this procedure. These tools offer easy editing and sharing capabilities, fostering better collaboration and faster iteration cycles. Additionally, maintaining a version history within these tools allows you to track changes and decisions made throughout the coding process, ensuring transparency and accountability. As highlighted in recent studies, clear documentation and stakeholder engagement can lead to more robust design and development outcomes, ultimately improving the overall user experience.
Common Mistakes to Avoid in Flowchart Design
To create effective diagrams, it's essential to maintain clarity and simplicity. Begin by identifying the objective of your diagram, as this will direct the type and level of detail required. Utilize standardized symbols to avoid any ambiguity, ensuring each step is easily recognizable. For instance, a process diagram is ideal for mapping out business processes, while data flow diagrams are perfect for illustrating data movement in software development. Avoid overcrowding your diagram with excessive details that can overwhelm viewers. Instead, focus on making every step purposeful and contributing to the overall understanding. Examine your diagram frequently to guarantee it stays clear and effective for its intended audience.
Using Flowcharts in Coding Projects
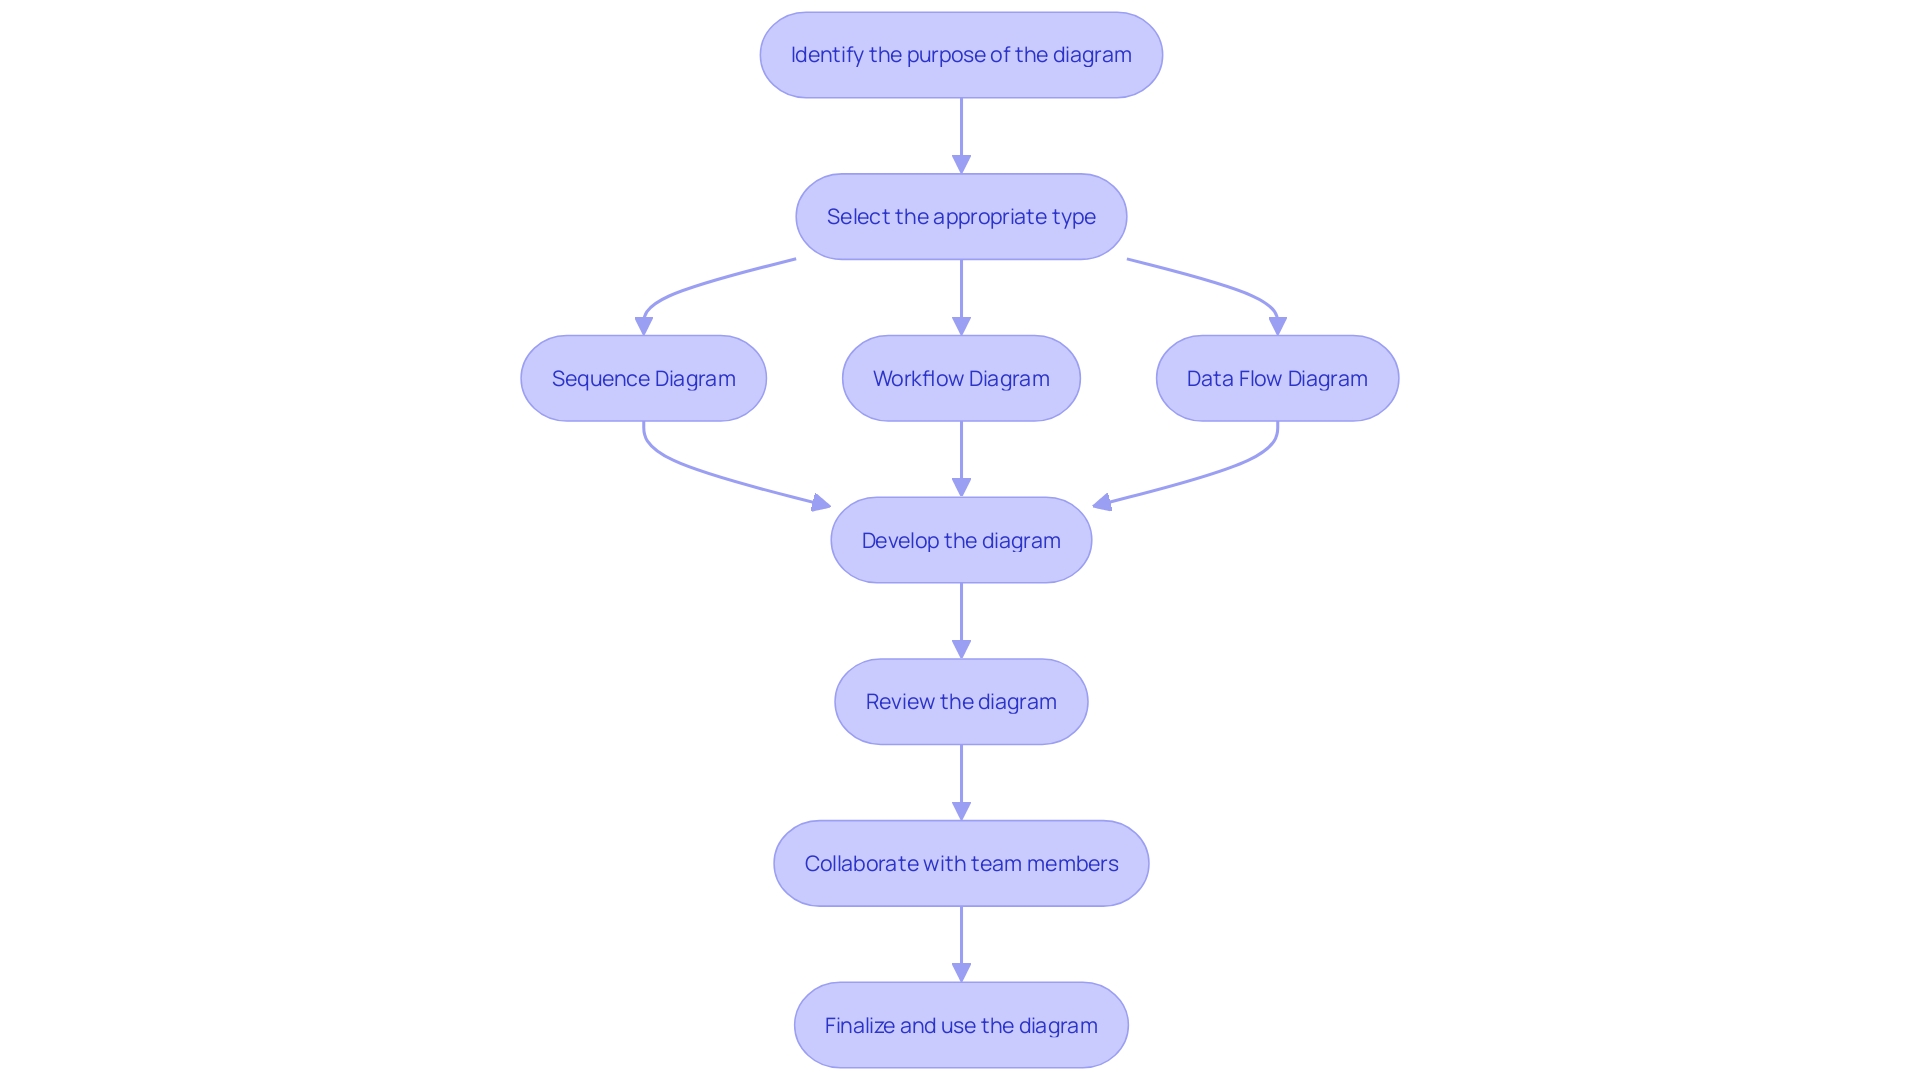
Include diagrams as a standard practice in your coding projects to enhance planning, execution, and troubleshooting. Begin by identifying the purpose of your diagram, as this will assist you in selecting the appropriate type and level of detail. Typical varieties consist of sequence diagrams for outlining steps, workflow diagrams for monitoring tasks through stages, and data flow diagrams for depicting data movement in software systems.
Utilizing diagrams in the early stages of development assists in detailing procedures distinctly, simplifying their review during troubleshooting. This method not only enhances team collaboration but also serves as a valuable documentation tool. Regularly review the flowchart for clarity and share it with colleagues for feedback to ensure it accurately represents the process and is easy to understand.
Conclusion
Flowcharts serve as vital instruments in the software development landscape, streamlining complex coding processes into clear, visual representations. By depicting the flow of logic and decision-making, they enhance understanding among team members and facilitate effective communication. The ability to visualize intricate relationships within code not only aids in troubleshooting but also significantly reduces onboarding time for new developers, fostering a more efficient workflow.
Creating a flowchart involves several key steps, from identifying the core processes to selecting appropriate symbols and adhering to principles of clarity and simplicity. Each step contributes to a comprehensive diagram that effectively communicates the intended logic. Regular updates and collaborative feedback further refine the flowchart, ensuring it remains a relevant and useful tool throughout the development cycle.
Incorporating flowcharts into coding projects can transform how teams plan, execute, and troubleshoot their work. By establishing a standard practice of using these visual aids, developers can enhance collaboration and maintain a clear understanding of processes. Ultimately, flowcharts not only improve the quality of documentation but also lead to more successful project outcomes, making them an indispensable asset in the software development toolkit.
Frequently Asked Questions
What are flowcharts, and why are they important in software development?
Flowcharts are visual diagrams that illustrate workflows, enabling developers to see the flow of logic and decision-making in their code. They simplify complex coding structures, making it easier to understand the sequence of operations and the relationships between various components.
How do flowcharts enhance communication among team members?
Flowcharts clarify thought processes and provide a shared visual language, fostering a common understanding among team members. This enhances communication and streamlines the coding workflow, allowing for better conceptualization, communication, and refinement of ideas.
What role do diagrams play in technical onboarding?
Diagrams significantly reduce the time new software professionals spend understanding existing systems, thereby improving overall efficiency. They serve as visual aids that help newcomers become productive more quickly.
What are the key steps to creating an effective flowchart?
To create an effective flowchart, follow these steps: Define the process or task you want to visualize. Break down the coding project into essential elements. Review the diagram for clarity and share it for feedback. Make necessary adjustments based on feedback.
What types of shapes are commonly used in flowcharts and what do they represent?
Common shapes include: Ovals (terminal shapes) for starting and ending points. Rectangles for specific tasks or actions. Diamonds for decision points. Arrows to indicate the flow direction.
What principles should be followed to ensure clarity in flowcharts?
Key principles include simplicity, clarity, and logical flow. Maintain a clean layout, use consistent colors and styles, and review the diagram for coherence.
How can I validate my diagrams for accuracy?
Validation involves confirming that all user interactions and system behaviors are documented correctly, and that functional requirements are met. Engaging stakeholders and using online diagram tools can facilitate this process.
Why is it important to use standardized symbols in diagrams?
Standardized symbols help avoid ambiguity, ensuring that each step in the diagram is easily recognizable and understood by all stakeholders.
Can you provide examples of different types of diagrams used in software development?
Examples include: Sequence diagrams for detailing steps in a process. Workflow diagrams for tracking task movement. Data flow diagrams for illustrating data movement within software systems.
How often should I review and revise my flowchart?
Regularly review and revise your flowchart to reflect any changes in the coding process. Gathering feedback from team members can also help improve the diagram's clarity and effectiveness.


