Introduction
In the ever-evolving landscape of software development and PC building, understanding debug codes has become an essential skill for enthusiasts and professionals alike. These codes serve as vital indicators, guiding users through troubleshooting processes and enabling swift resolutions to common hardware and software issues. With the integration of AI-driven tools like Kodezi, the debugging journey transforms from a daunting task into a streamlined experience, enhancing productivity and efficiency.
As technology advances, embracing these innovations not only simplifies error correction but also empowers developers to optimize their workflows, ensuring they remain at the forefront of performance and reliability. This article delves into the significance of debug codes, practical applications, and the future of debugging, equipping readers with the knowledge to tackle challenges head-on.
Understanding Debug Codes: An Introduction for Beginners
In the field of software creation, AI plays an essential part in troubleshooting, ensuring that your program can be compiled effectively. The AI troubleshooting function aims to finish unfinished scripts for successful compilation, improving efficiency.
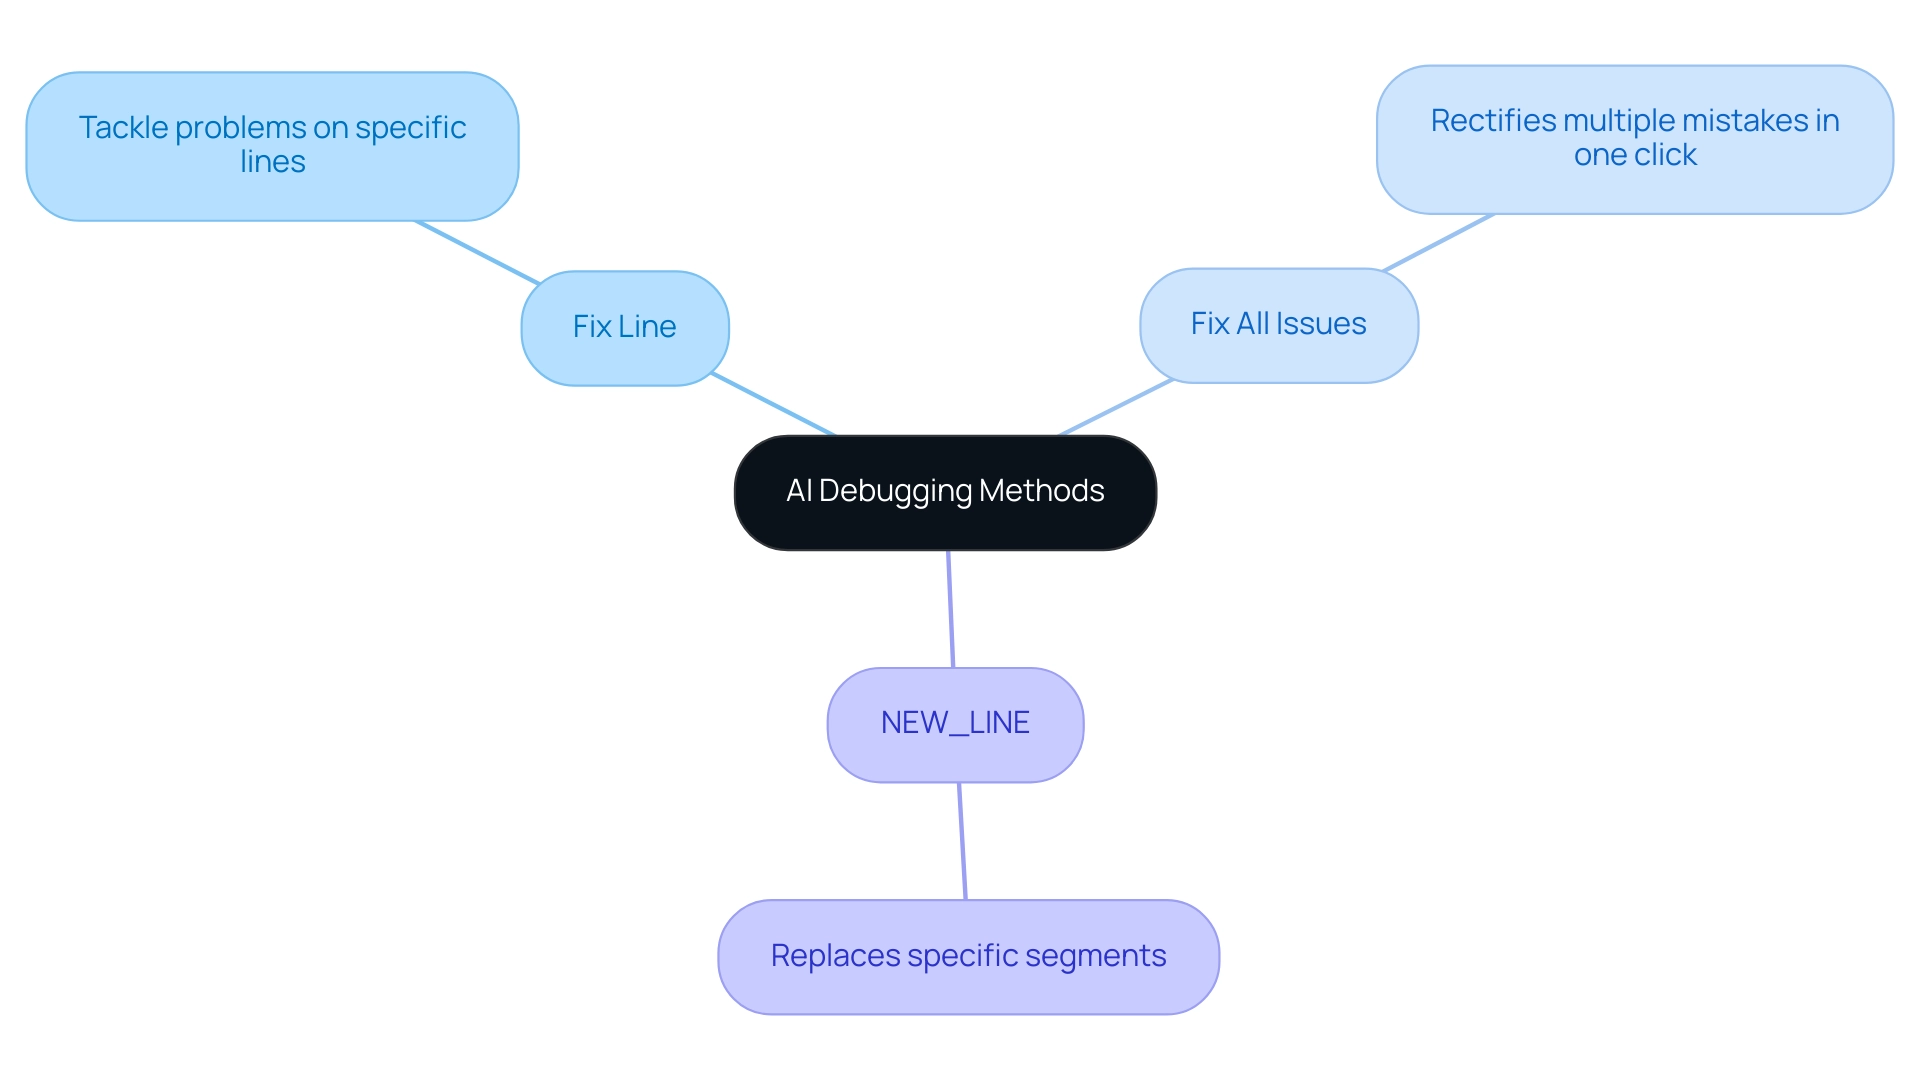
- 'Fix Line' methods enable you to tackle problems on specific lines, whereas 'Fix All Issues' rectifies multiple mistakes in one click, substituting your original file with a corrected version.
- The purple button 'NEW_LINE' replaces specific segments, simplifying the debugging process.
Adopting these AI-driven tools is crucial for any tech enthusiast seeking maximum productivity and system reliability, as they simplify issue resolution and enhance overall performance.
Practical Applications of Debug Codes in PC Building and Gaming
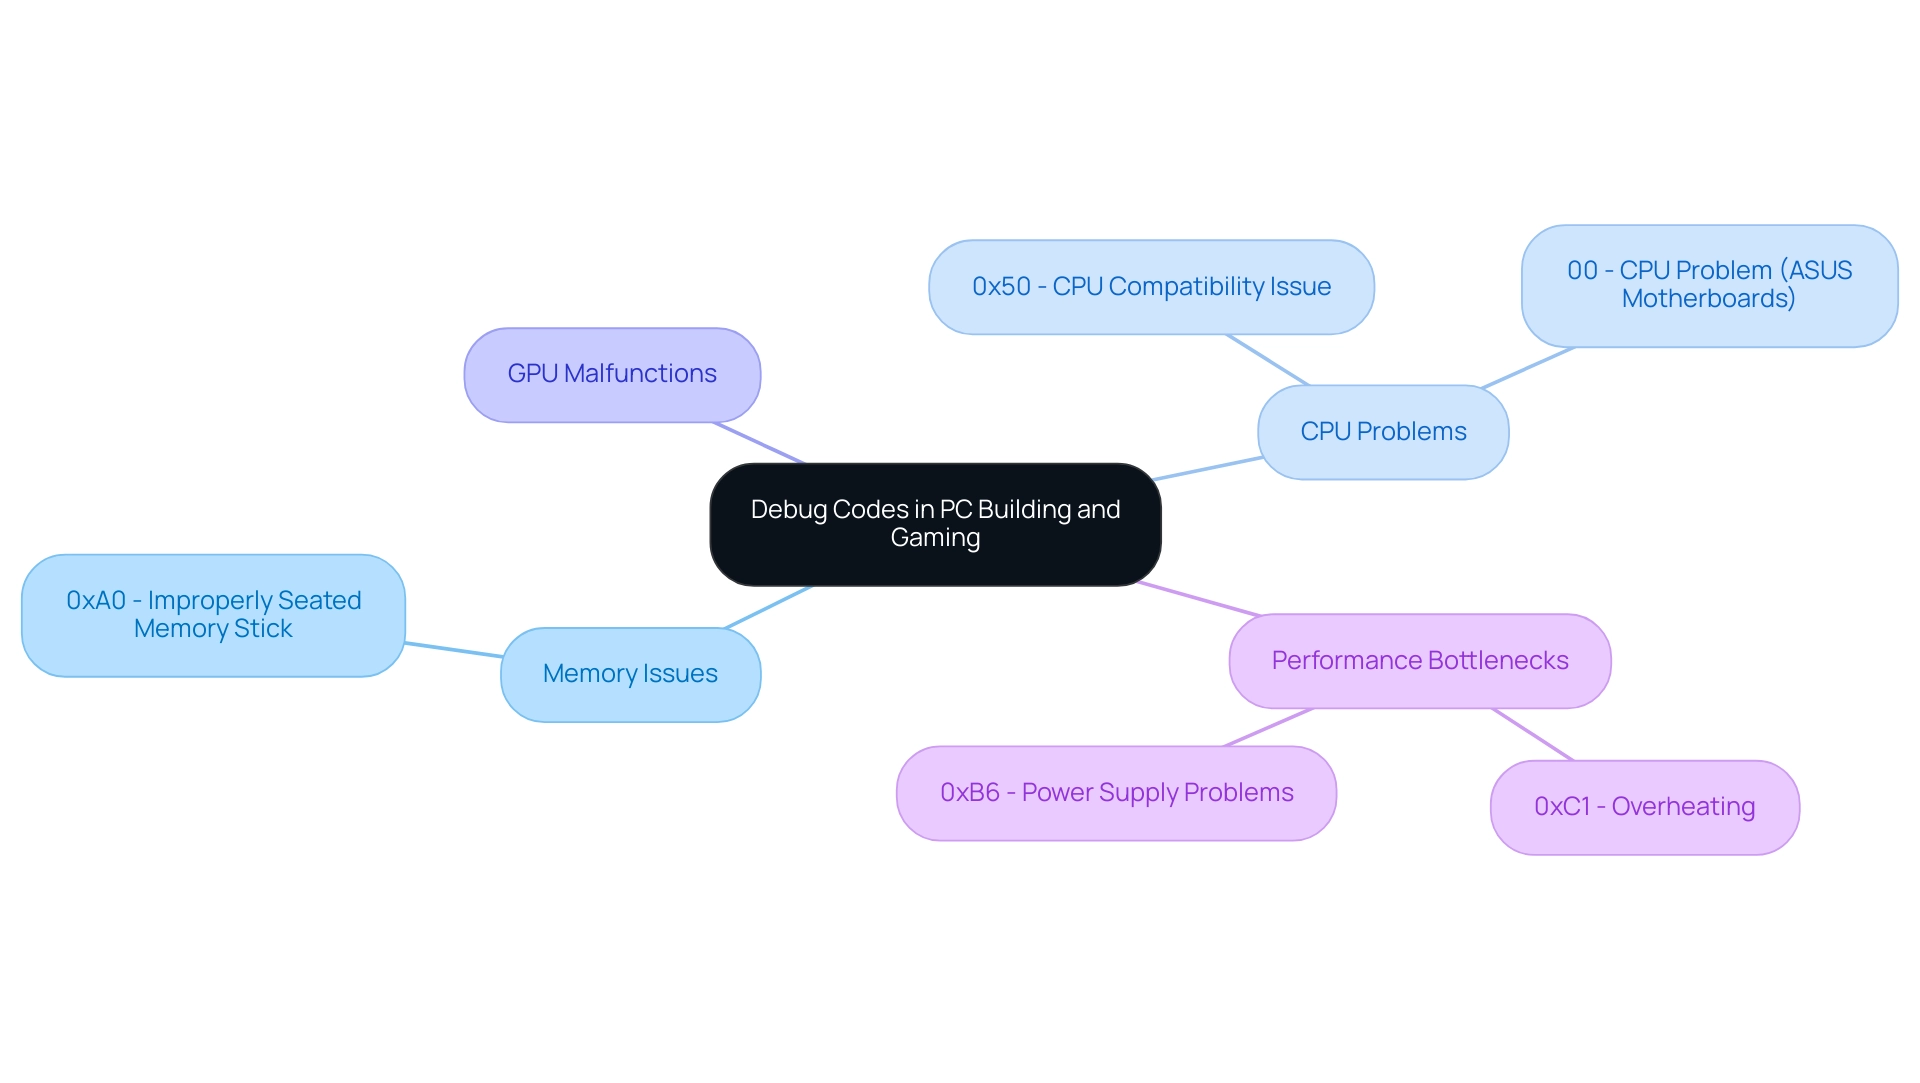
In the realm of PC building, debug messages play a crucial role in identifying and resolving issues such as memory failures, GPU malfunctions, or CPU incompatibility. For example, a fault 0xA0 during the boot process may suggest an improperly seated memory stick, permitting swift corrective actions. Likewise, a fault 0x50 could indicate a CPU-related issue, encouraging users to verify compatibility or reseat the processor. Comprehending these signals is especially crucial in gaming, where they assist in identifying performance bottlenecks; for instance, notification 0xC1 indicates overheating, allowing prompt actions to improve the gameplay experience.
Statistics indicate that numerous PC builders face error messages, such as an exit number of 1 during setup, emphasizing the importance of comprehending debug information. A post by flexyyyapk illustrates this, as they successfully resolved an installation problem by following troubleshooting advice. User kingdavid72 also confirmed that upgrading pip and setuptools fixed their setup problems, showcasing the effectiveness of such interventions.
Recent trends indicate a growing reliance on automated programming debugging tools to optimize gaming performance. These tools enable users to instantly identify and resolve codebase problems while ensuring adherence to security best practices. Frequent issues associated with overheating and performance declines are now enhanced by features that improve formatting and exception management. For example, error 0xB6 can signify power supply problems, which can greatly affect gaming performance. Case studies, like the ongoing installation problems with the Pandas package, highlight the intricacy of troubleshooting and the necessity for a comprehensive grasp of these scripts.
Experts in PC building emphasize the importance of familiarizing oneself with hardware-specific debug signals, such as those used in ASUS motherboards (e.g., 00 for a CPU problem). Utilizing automated troubleshooting solutions streamlines the building process and ensures optimal gaming performance. As the environment of PC construction and gaming changes, staying updated on the newest error messages and automated troubleshooting methods is essential for efficiency and productivity. In conclusion, understanding debug symbols, combined with automated debugging, not only aids in troubleshooting but also plays a vital role in optimizing both PC building processes and gaming experiences, making it essential knowledge for enthusiasts seeking peak performance.
Troubleshooting with Debug Codes: Common Issues and Solutions
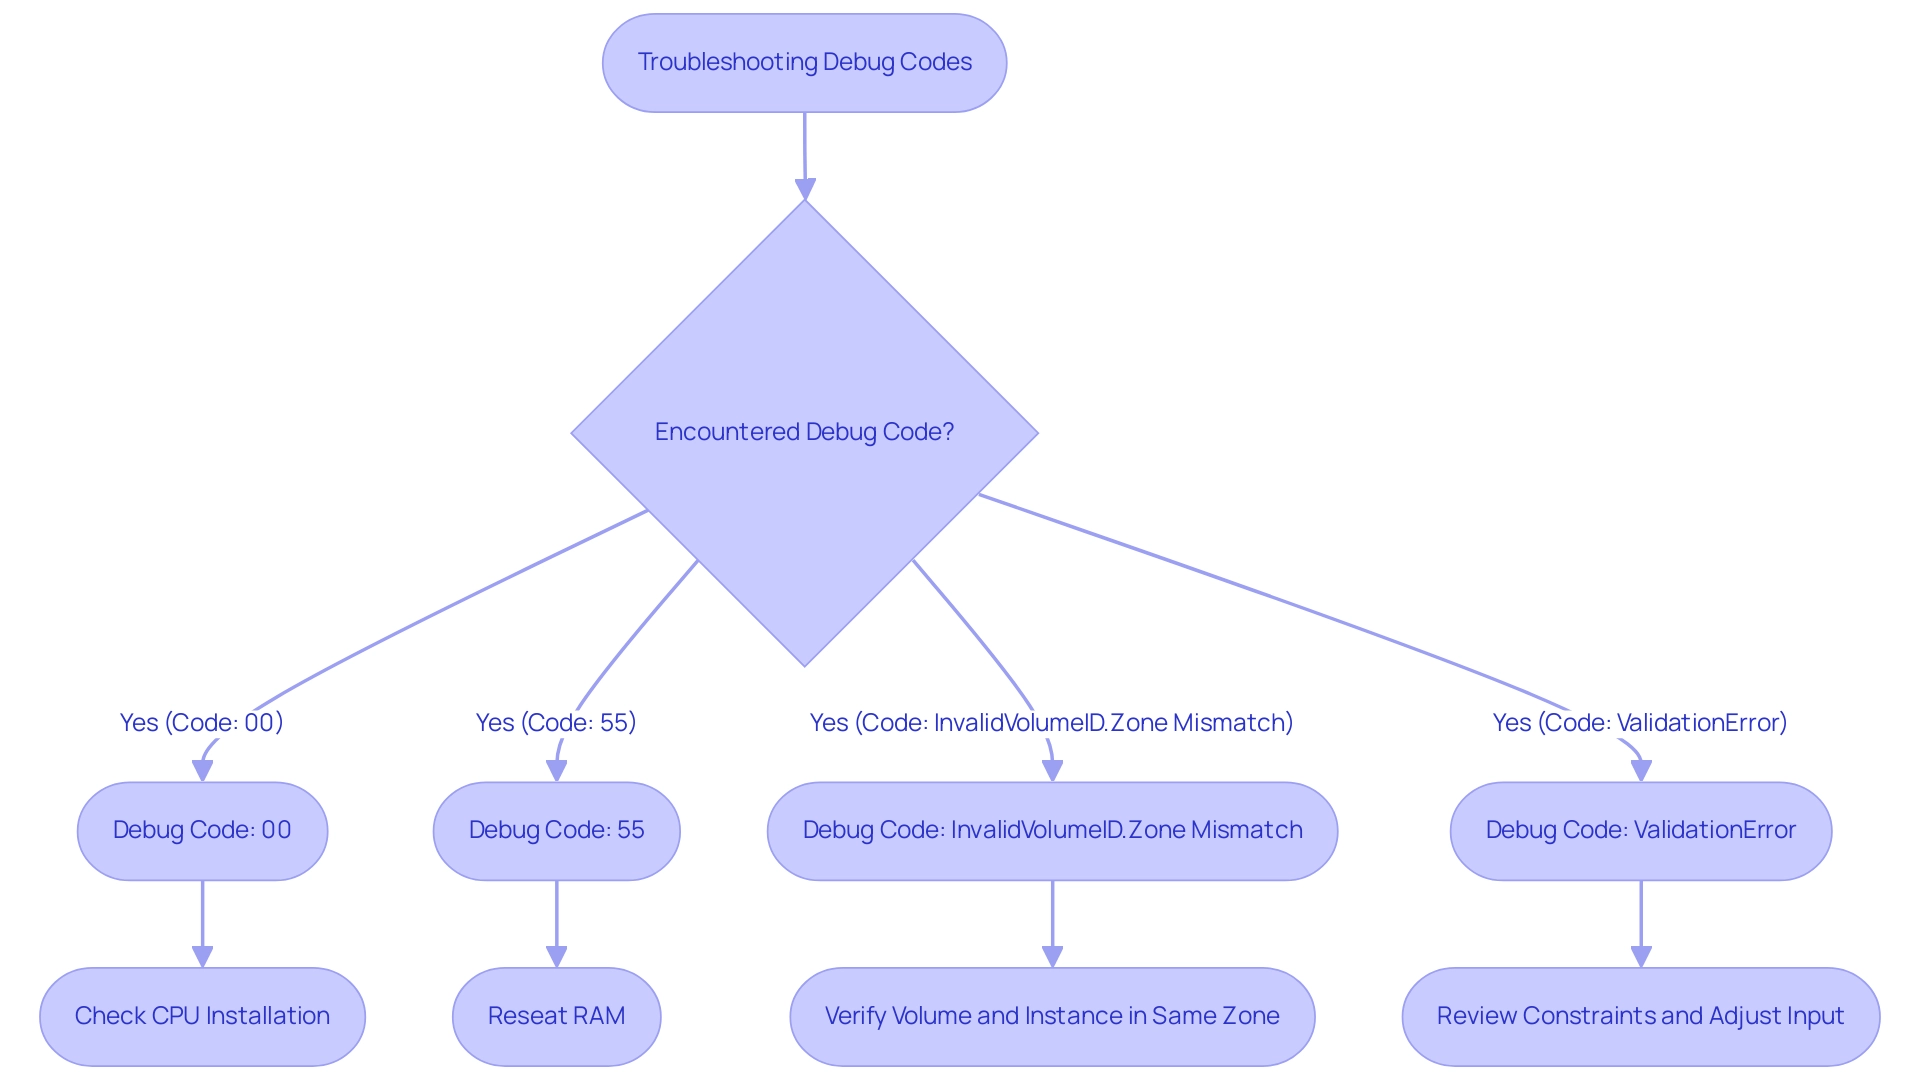
Comprehending common debug symbols can significantly streamline the troubleshooting process. Kodezi, an AI-driven programming tool, improves your coding workflow by offering automatic correction and bug analysis across multiple languages and IDEs. For instance, encountering the 00 designation during the Power-On Self-Test (POST) often indicates a failure in the initial hardware checks. To resolve this, ensure that the CPU is correctly installed and that all power connections are secure. Another common concern is the 55 signal, which typically indicates memory problems; reseating the RAM or trying different slots can often fix the problem.
By becoming acquainted with these systems and their meanings, you can effectively address hardware issues without experiencing extensive downtime. For example, the InvalidVolumeID.Zone Mismatch issue highlights the importance of verifying that specified volumes and instances are within the same Availability Zone to avoid disruptions. Additionally, reviewing cases like ValidationError, where inputs fail to meet AWS service constraints, emphasizes the necessity of adapting your approach based on specific constraints; thus, adjusting inputs accordingly is crucial.
Moreover, Kodezi's debugging features—such as Fix Line, which corrects specific lines, and Fix All Issues, which resolves multiple errors at once—ensure your work is ready for compilation. The NEW_LINE function allows you to easily organize your programming for better readability. Staying informed about recent solutions, including automated tools for diagnosing POST failure messages, ensures that you can swiftly and accurately identify and resolve issues. Real-world examples illustrate how effectively utilizing debug tools, along with Kodezi's capabilities, can lead to quicker resolutions, maximizing efficiency and productivity.
Exploring Manufacturer-Specific Debug Codes: A Guide
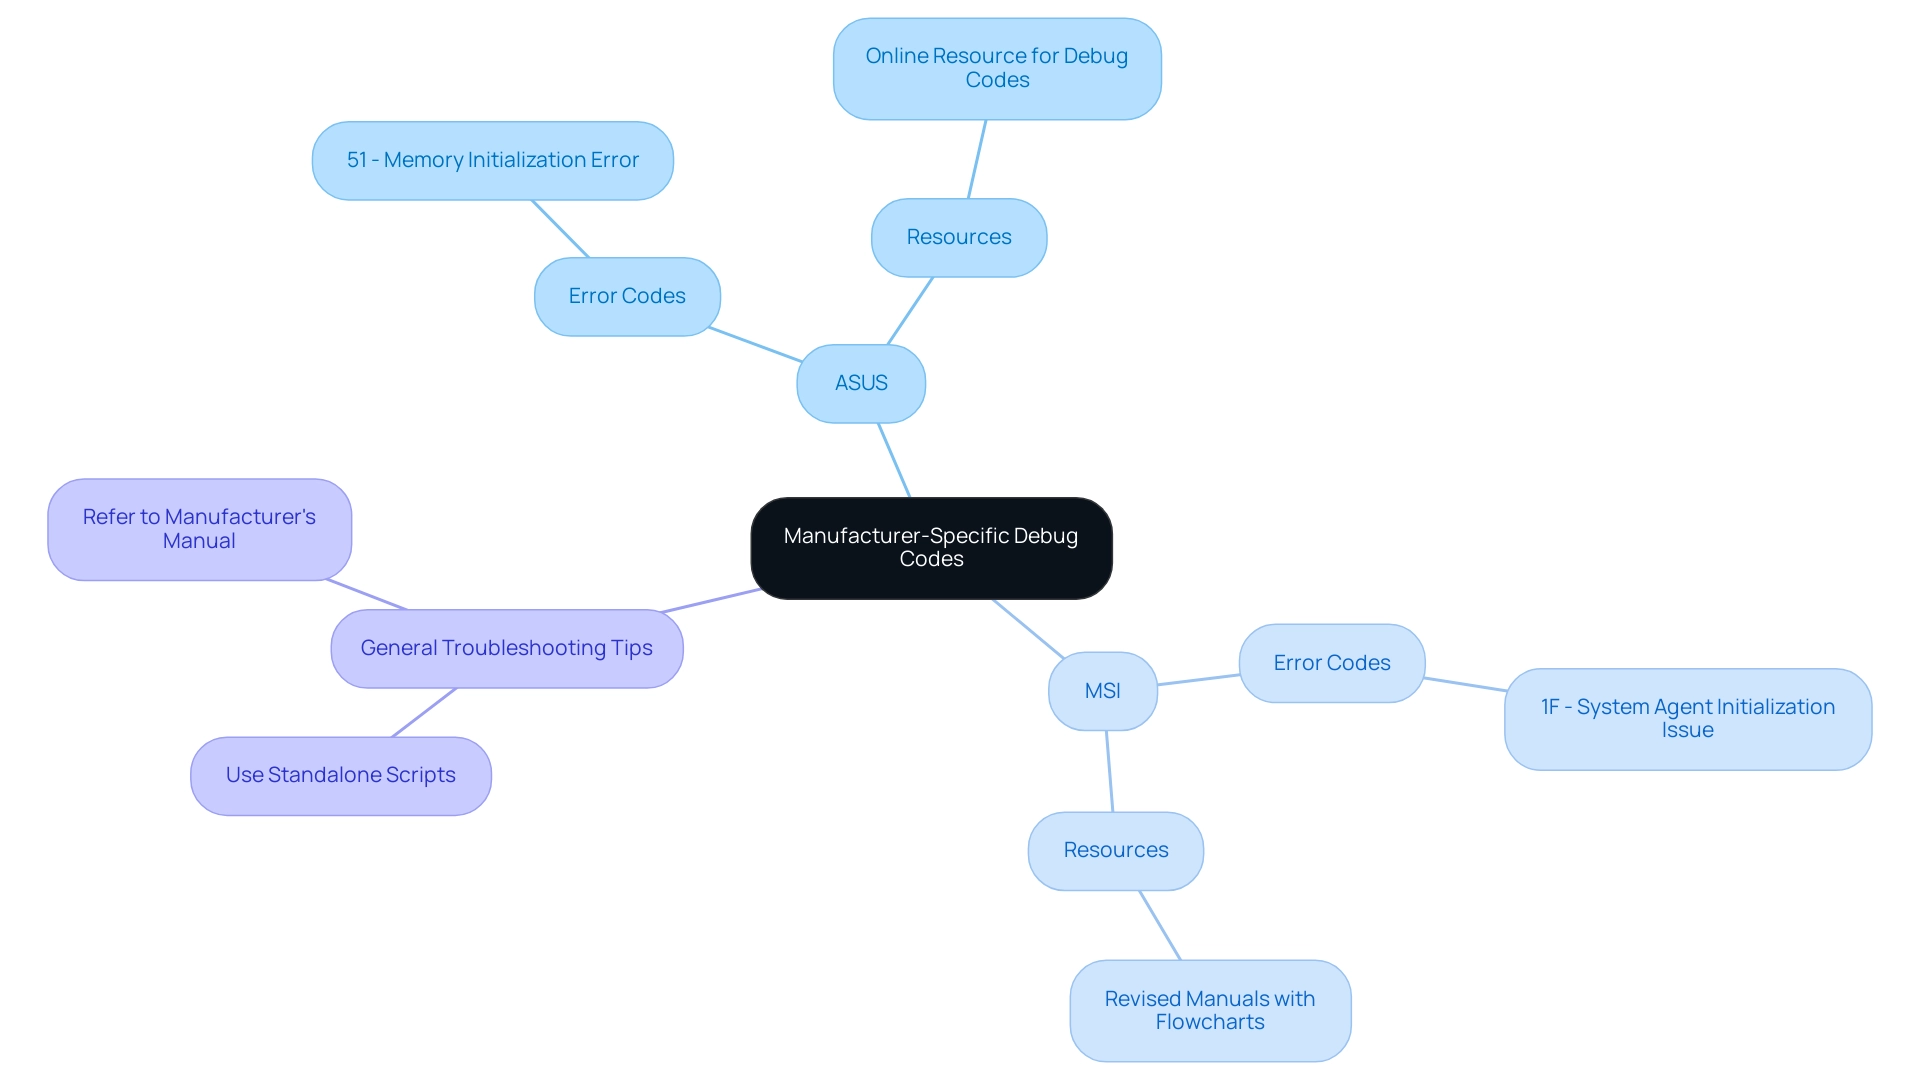
Navigating the terrain of manufacturer-specific error messages can often be overwhelming, particularly when developers invest over 200 hours each year troubleshooting. This time-consuming process is compounded by brand-specific variations, which add complexity to troubleshooting efforts. For instance, ASUS motherboards frequently display messages like 51, signaling memory initialization errors, while MSI boards might show a 1F message, indicating system agent initialization issues. Grasping these distinctions is vital for effective problem-solving and can significantly improve productivity, aligning with our mission to 10x efficiency in programming.
To simplify the troubleshooting process, it’s crucial to become acquainted with these numbers. Expert technician Johnny highlights the significance of clear and precise information when addressing debug sequences, stating, '>But maybe I am misunderstanding, do you have a screenshot of your input panel?<'.
Manufacturers like ASUS and MSI have released comprehensive guides to assist users with debugging. For example:
- ASUS has launched an online resource that clarifies the meanings of their symbols.
- MSI has revised its manuals to feature troubleshooting flowcharts.
These resources are invaluable for quickly referencing and resolving issues, ultimately enhancing operational efficiency.
When utilizing Kodezi's AI for debugging, ensure that you input standalone scripts that can be compiled. The AI's primary purpose is to ensure that your program compiles successfully, even finishing unfinished scripts when necessary. Always refer to your motherboard’s manual or the manufacturer's website for a comprehensive list of debug codes specific to your hardware. By utilizing these resources and Kodezi's advanced troubleshooting features, you can ensure a more efficient and productive process, aligning with our broader goal of maximizing efficiency in software development.
The Future of Debugging: Trends and Innovations in Debug Codes
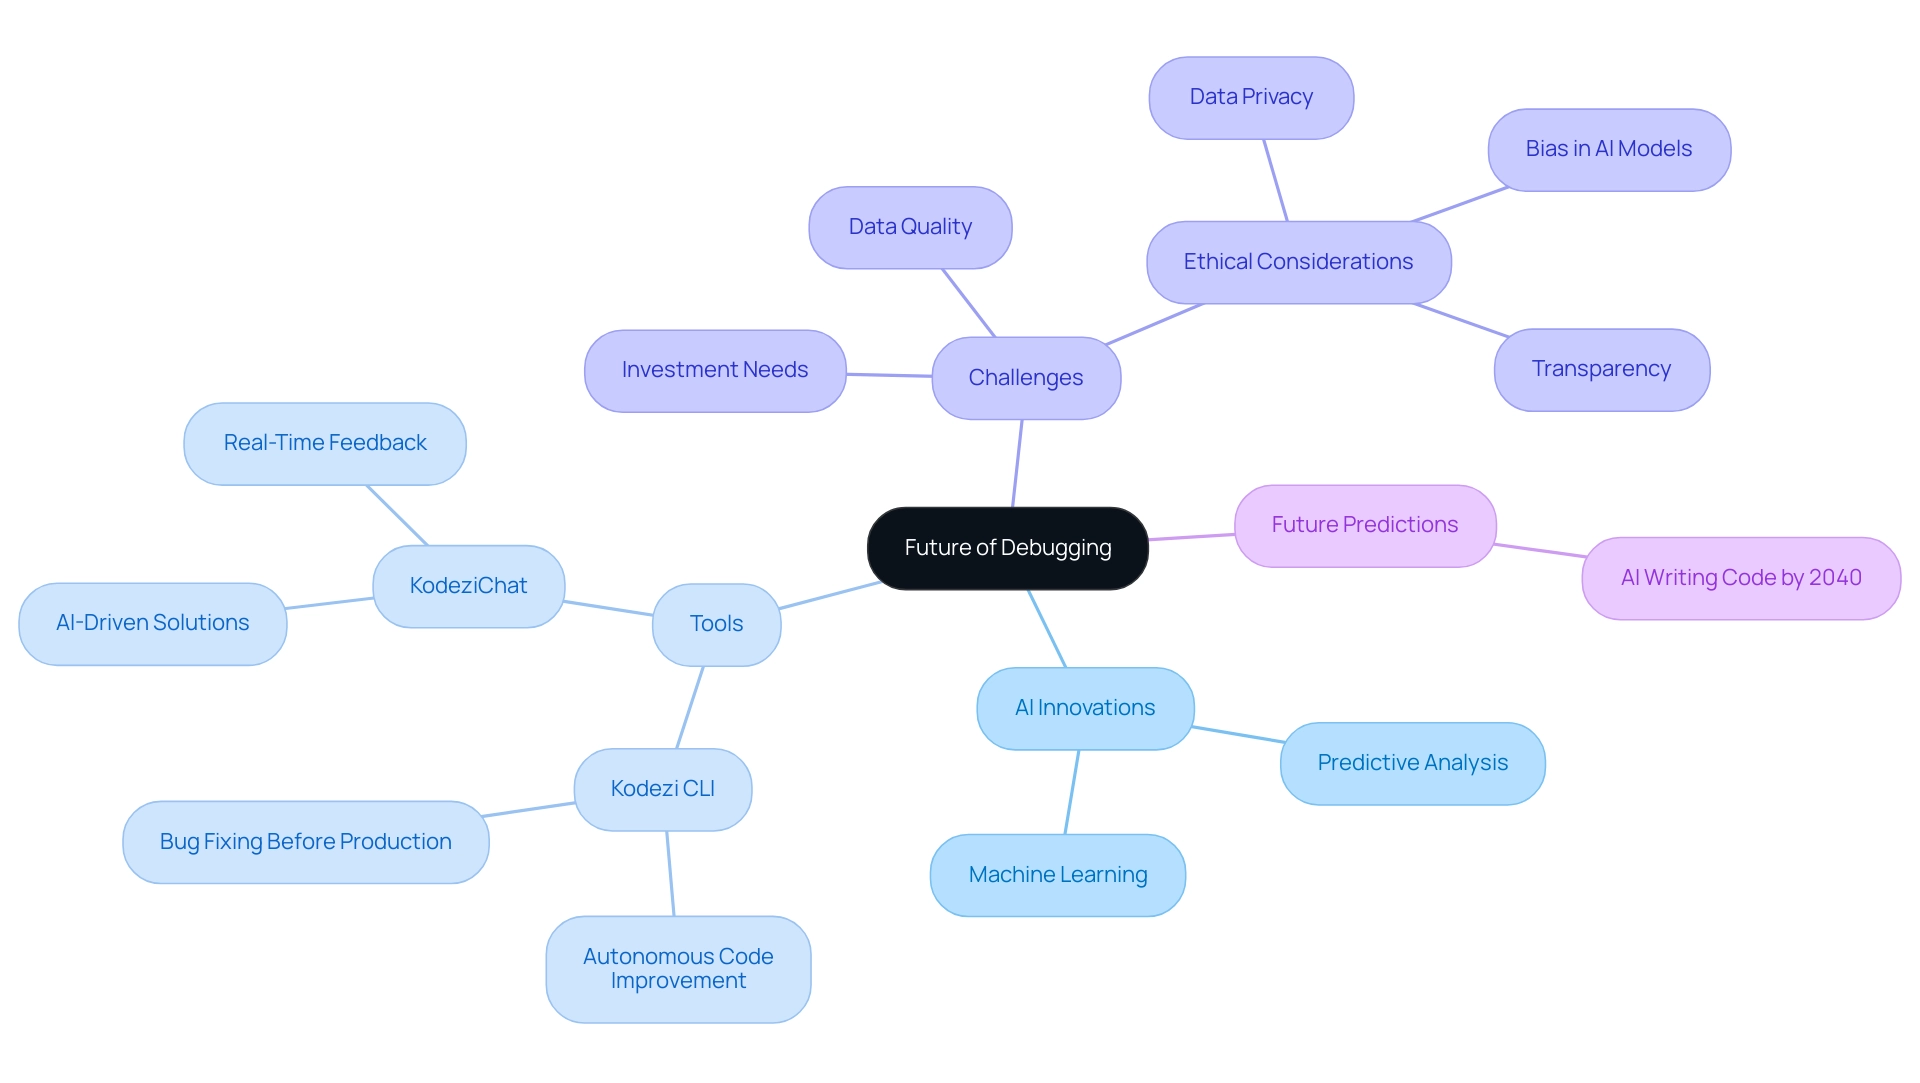
As technology swiftly progresses, the methodologies and tools for troubleshooting are undergoing significant transformations. The demand for AI-related positions has more than doubled over the past three years, highlighting the increasing significance of AI in various fields, including error correction. Innovations in artificial intelligence and machine learning are beginning to reshape debugging practices by enabling predictive analysis of potential problems before they arise. This proactive approach enhances efficiency, minimizes downtime, and improves overall system reliability. Tools like Kodezi CLI exemplify this shift, autonomously improving codebases and fixing bugs before they reach production, allowing teams to never waste time on pull requests again.
Furthermore, the incorporation of advanced diagnostic tools, such as KodeziChat, offers AI-driven solutions for swift programming question resolution and problem solving. This revolutionizes real-time feedback mechanisms by offering immediate insights into system performance. Researchers predict that the combination of machine learning, artificial intelligence, natural language processing, and code generation technologies will evolve to the point where machines could write most of their own code by 2040. This forward-thinking perspective highlights the transformative potential of AI in software development.
However, while the benefits of integrating AI into error detection are significant, organizations must address several challenges. For instance, ensuring data quality and navigating the opaque nature of some AI models are practical hurdles that must be overcome. Kodezi tools specifically help tackle these challenges by providing robust solutions that enhance data quality and transparency. Furthermore, the need for substantial investment and expertise cannot be overlooked. Ethical considerations, including data privacy, potential bias in AI models, and transparency in AI processes, are critical factors that organizations must navigate to build trust with users and stakeholders.
Looking ahead, the continued integration of AI into error detection practices promises to deliver even more sophisticated tools and techniques. By leveraging solutions like Kodezi CLI and KodeziChat, engineering teams can stay informed about these innovations while ensuring their debugging processes remain cutting-edge and highly efficient.
Conclusion
Embracing the importance of debug codes is essential for anyone involved in software development or PC building. These codes serve as critical indicators that guide troubleshooting efforts, helping users identify and resolve issues swiftly. With the advent of AI-driven tools like Kodezi, the debugging process is not only simplified but also significantly enhanced, enabling users to tackle challenges with confidence and efficiency.
The practical applications of debug codes extend across various domains, from diagnosing hardware failures in PC building to optimizing gaming performance. Understanding these codes empowers developers and enthusiasts alike to act quickly, minimizing downtime and ensuring systems run smoothly. As demonstrated throughout the article, familiarizing oneself with manufacturer-specific codes and leveraging automated debugging solutions can lead to a more streamlined and productive experience.
Looking ahead, the integration of AI in debugging practices continues to evolve, promising innovative solutions that will further revolutionize the landscape. By utilizing tools like Kodezi, users can enhance their coding workflows, automate error correction, and ensure their projects are always on track. The future of debugging is bright, and staying informed about these trends will be pivotal for anyone aiming to maximize their efficiency and productivity in this fast-paced technological environment.
Frequently Asked Questions
What role does AI play in software creation and troubleshooting?
AI plays an essential role in troubleshooting by helping to ensure that programs can be compiled effectively. It includes features like finishing unfinished scripts and improving efficiency during the compilation process.
What are the different AI troubleshooting methods mentioned?
The AI troubleshooting methods include 'Fix Line,' which addresses issues on specific lines, 'Fix All Issues,' which corrects multiple mistakes in one click, and the 'NEW_LINE' function that simplifies the debugging process by replacing specific segments.
Why is understanding debug messages important in PC building?
Understanding debug messages is crucial for identifying and resolving hardware issues, such as memory failures or GPU malfunctions. These messages provide insights that enable swift corrective actions, enhancing the overall performance of the system.
Can you give examples of common debug messages and their meanings?
Yes, for instance, a fault 0xA0 may indicate an improperly seated memory stick, while 0x50 could suggest a CPU-related issue. Understanding these signals is vital for troubleshooting effectively.
How does Kodezi assist in the debugging process?
Kodezi is an AI-driven programming tool that offers automatic correction and bug analysis across various programming languages and IDEs. It includes features like Fix Line and Fix All Issues to streamline the coding workflow.
What challenges are associated with integrating AI into error detection?
Challenges include ensuring data quality, navigating the opaque nature of some AI models, and addressing ethical considerations like data privacy and potential bias in AI processes.
What are the future implications of AI in software development?
The integration of AI into error detection practices is expected to lead to more sophisticated tools and techniques, potentially allowing machines to write most of their own code by 2040, thus transforming software development processes.
How can manufacturers' guides assist in troubleshooting?
Manufacturers like ASUS and MSI provide comprehensive guides that clarify the meanings of their specific error messages and offer troubleshooting flowcharts, which can significantly enhance operational efficiency during debugging.
What is the significance of staying updated on error messages and automated debugging methods?
Staying informed about the latest error messages and automated troubleshooting methods is essential for optimizing efficiency and productivity in both PC building and gaming experiences.


