Introduction
In the realm of programming, the ability to visualize complex logic can be a game-changer. Converting code into flowcharts not only enhances comprehension but also streamlines the debugging process, making it easier for developers to optimize their work. With innovative tools like Kodezi, programmers can transform their coding practices by effortlessly creating flowcharts that clarify the flow of control and data.
This article delves into the fundamental aspects of code to flowchart conversion, offering a step-by-step guide to utilizing flowchart software effectively, highlighting best practices, and identifying common pitfalls to avoid. By embracing these techniques, developers can foster better collaboration, boost productivity, and ultimately refine their coding efficiency.
Understanding the Basics of Code to Flowchart Conversion
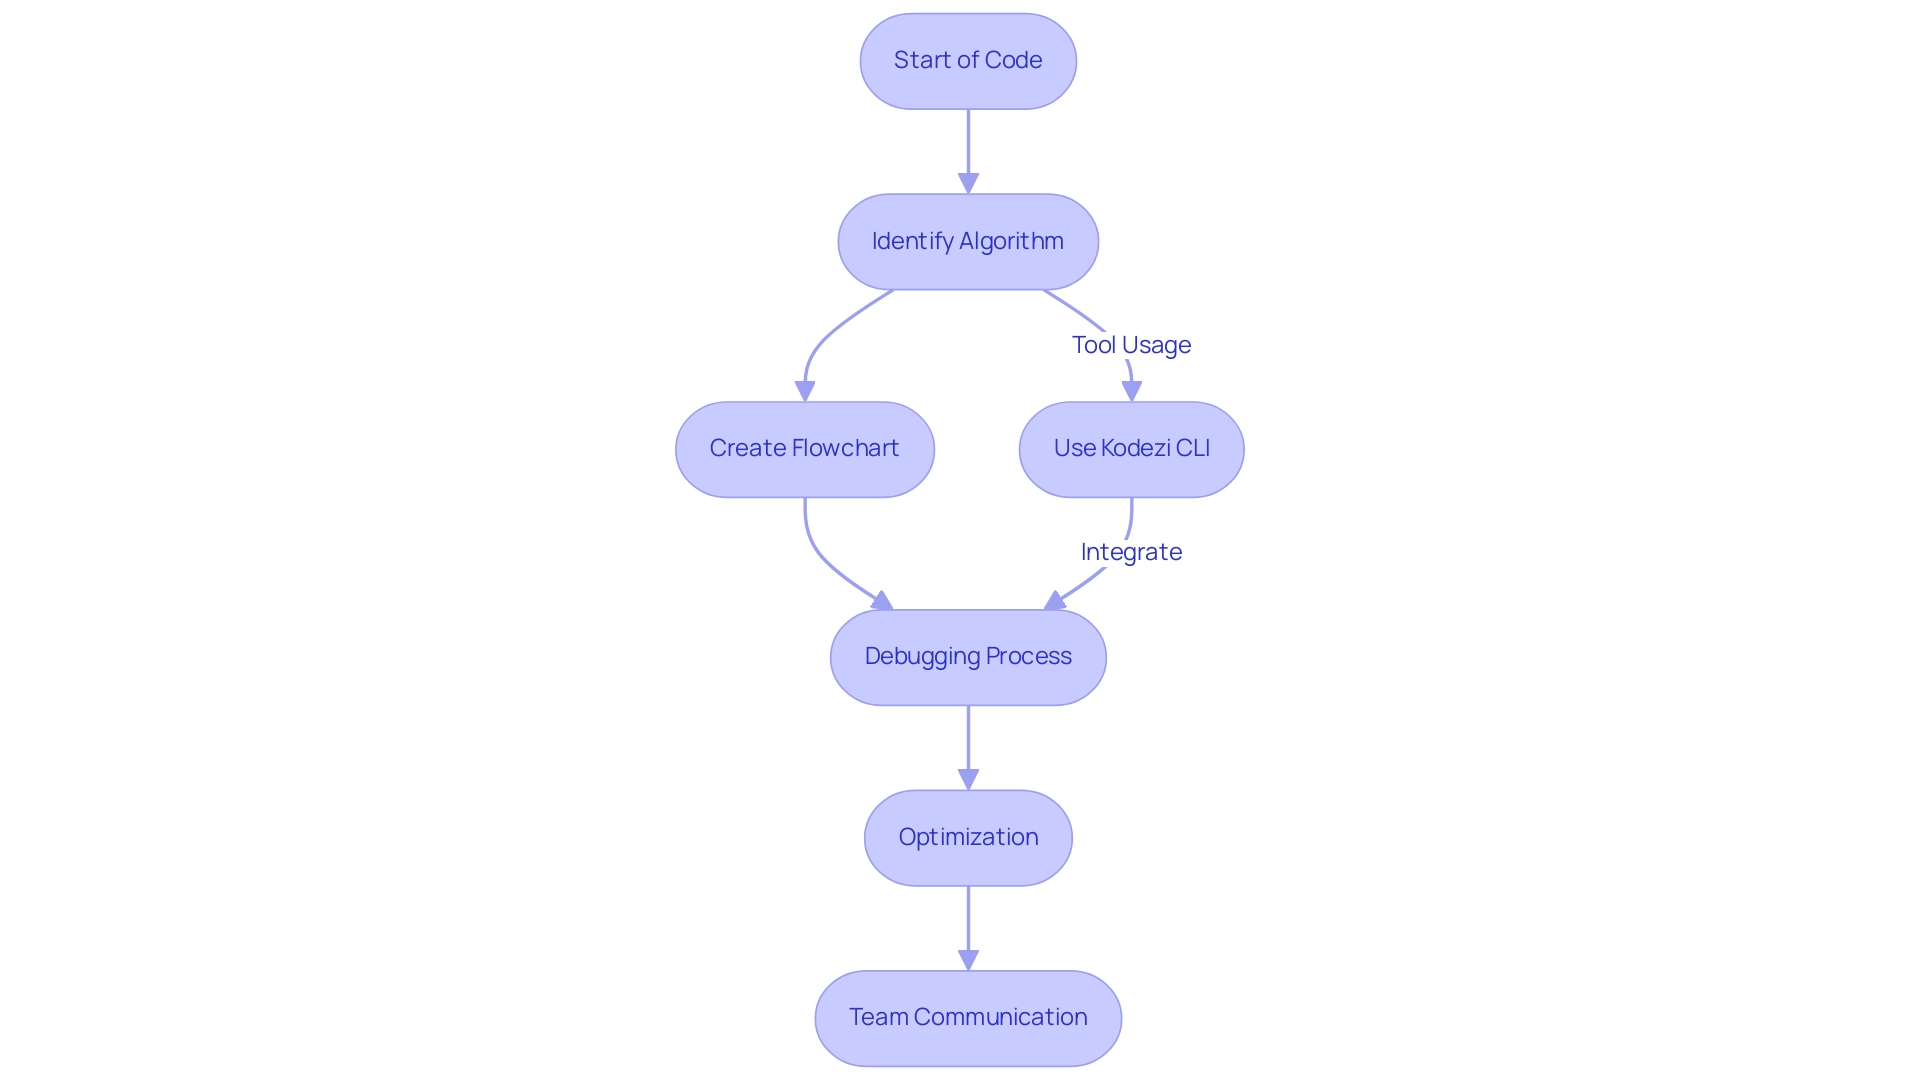
Transforming scripts into flowcharts is a powerful technique for visualizing and comprehending programming logic, and with tools like Kodezi Code, the Swiss-Army Knife for programmers, this process becomes even more efficient. Flowcharts provide a graphical representation of algorithms, making it easier for developers to trace the flow of control and information within their programs. This visualization method is especially advantageous for debugging, optimizing, and conveying functionality to team members or stakeholders.
Recent advancements in automated tools, such as Kodezi CLI, the Swiss-Army Knife for teams, allow for rapid healing and debugging, ensuring that codebases are optimized for performance and security compliance. These tools instantly identify and fix codebase issues, providing detailed explanations of what went wrong and how it was resolved.
For example, a study featuring a flow diagram with 1000 nodes and 1997 directed edges illustrated the usefulness of such diagrams in handling intricate programming structures. The Structured Program Theorem further supports this approach by illustrating that any computation can be implemented using structured programming constructs, thus eliminating the need for goto statements.
Expert insights emphasize the importance of this method; as noted by Josh, 'If you're describing the former, then all you need to do is note that your goto labels are states in and of themselves.' Practical instances, like the application of diagrams in extensive software initiatives, demonstrate how visualizing programming logic can result in improved team cooperation and a clearer comprehension of functionality.
By integrating Kodezi's advanced optimization features, developers can break down code into visual components, easily identify inefficiencies, redundancies, or potential improvements, and ultimately achieve a more streamlined and efficient codebase. Comprehending the advantages of diagrams is crucial for developers seeking to improve their coding methods through effective visualization techniques.

Step-by-Step Guide to Using Flowchart Software
-
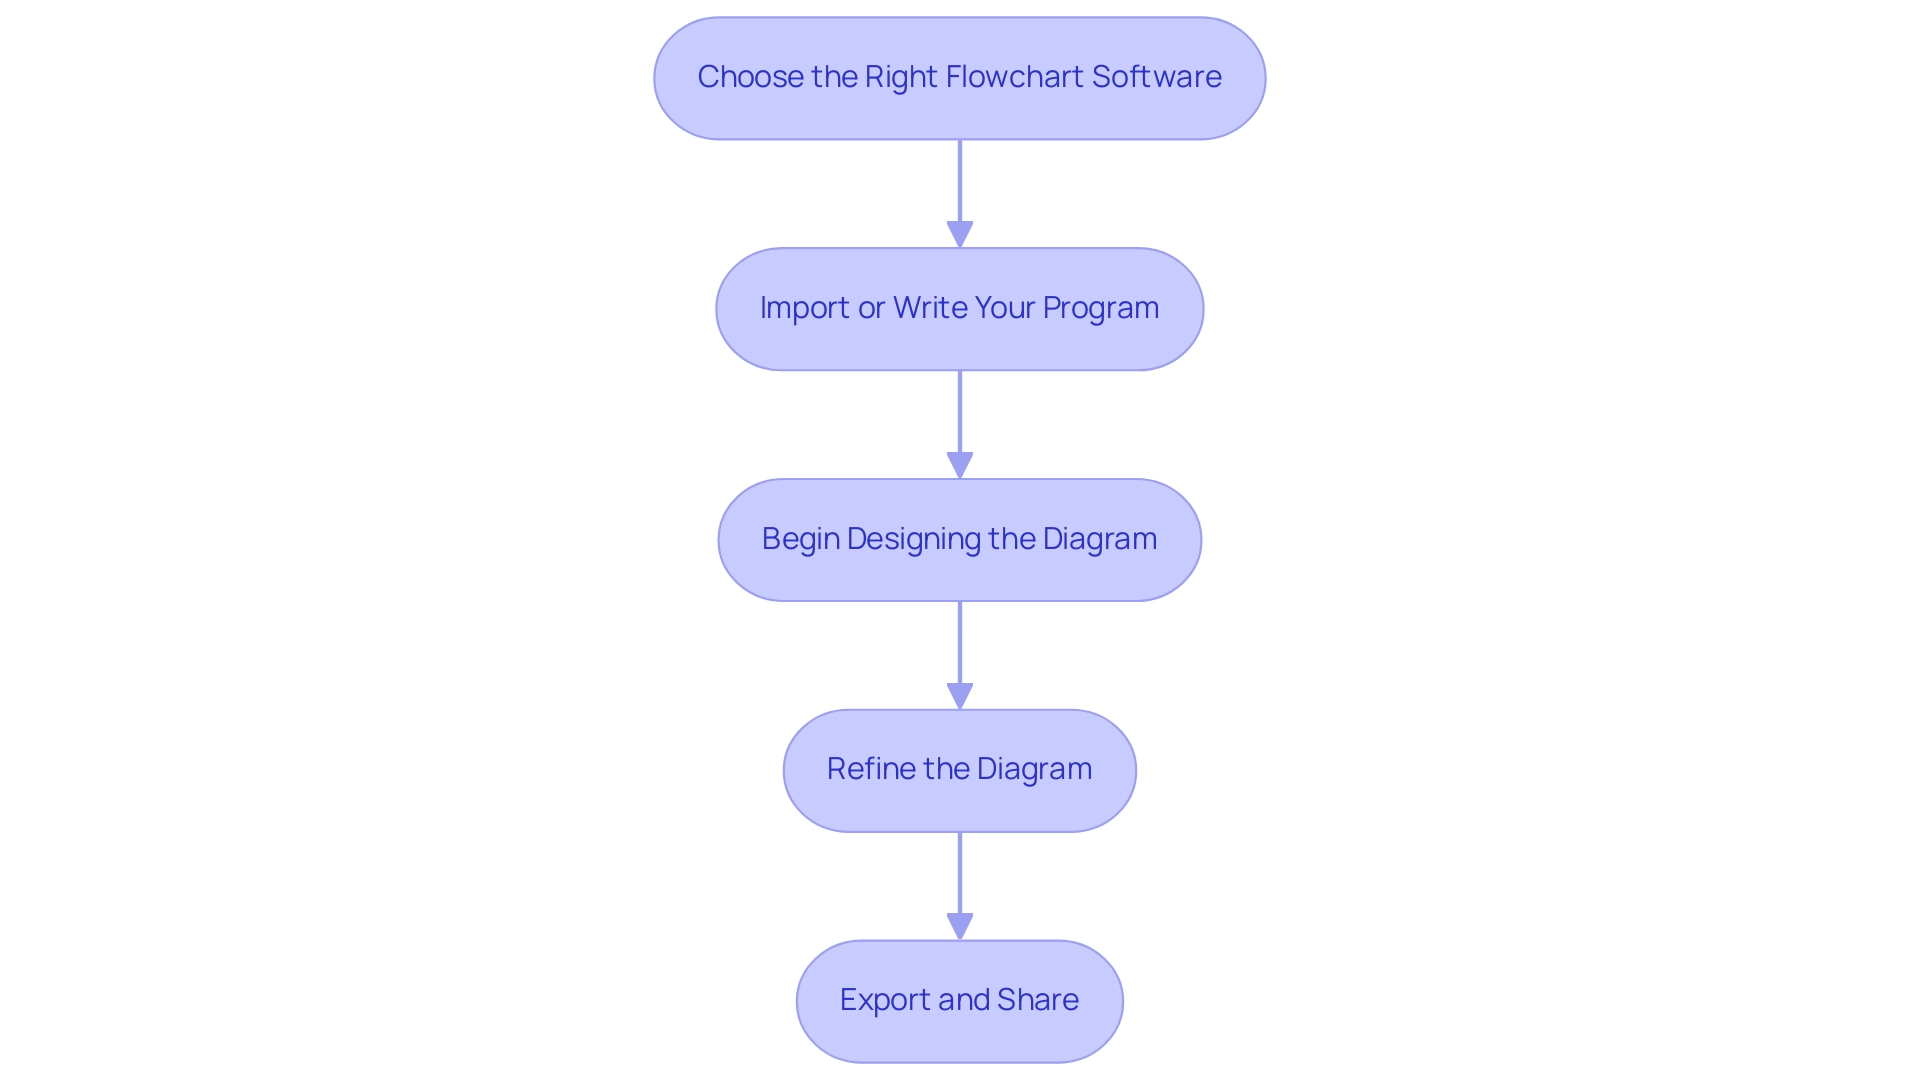
Choose the Right Flowchart Software: Select a flowchart tool that suits your needs. Popular options include Lucidchart, Microsoft Visio, and draw.io. Consider features like ease of use, templates, and integration capabilities.
-
Import or Write Your Program: If your software permits, import your script directly. Alternatively, open a new document and manually input your snippets.
Identify Key Components: Break down your code into its primary components, such as functions, loops, and conditionals. This step is crucial for accurately representing the logic in your flowchart.
-
Begin Designing the Diagram: Utilize diagram symbols (ovals for start/end, rectangles for processes, diamonds for decisions) to represent the components identified. Connect these symbols with arrows to illustrate the flow of control.
-
Refine the Diagram: Review your diagram for clarity and accuracy. Ensure that all paths are logically represented and that the flow is easy to follow. Adjust the layout for better readability.
-
Export and Share: Once satisfied, export your diagram in the desired format (PDF, PNG, etc.) and share it with your team for feedback or further collaboration. This step facilitates collaborative enhancement and guarantees your diagram serves its intended purpose effectively.

Best Practices for Flowchart Creation
-
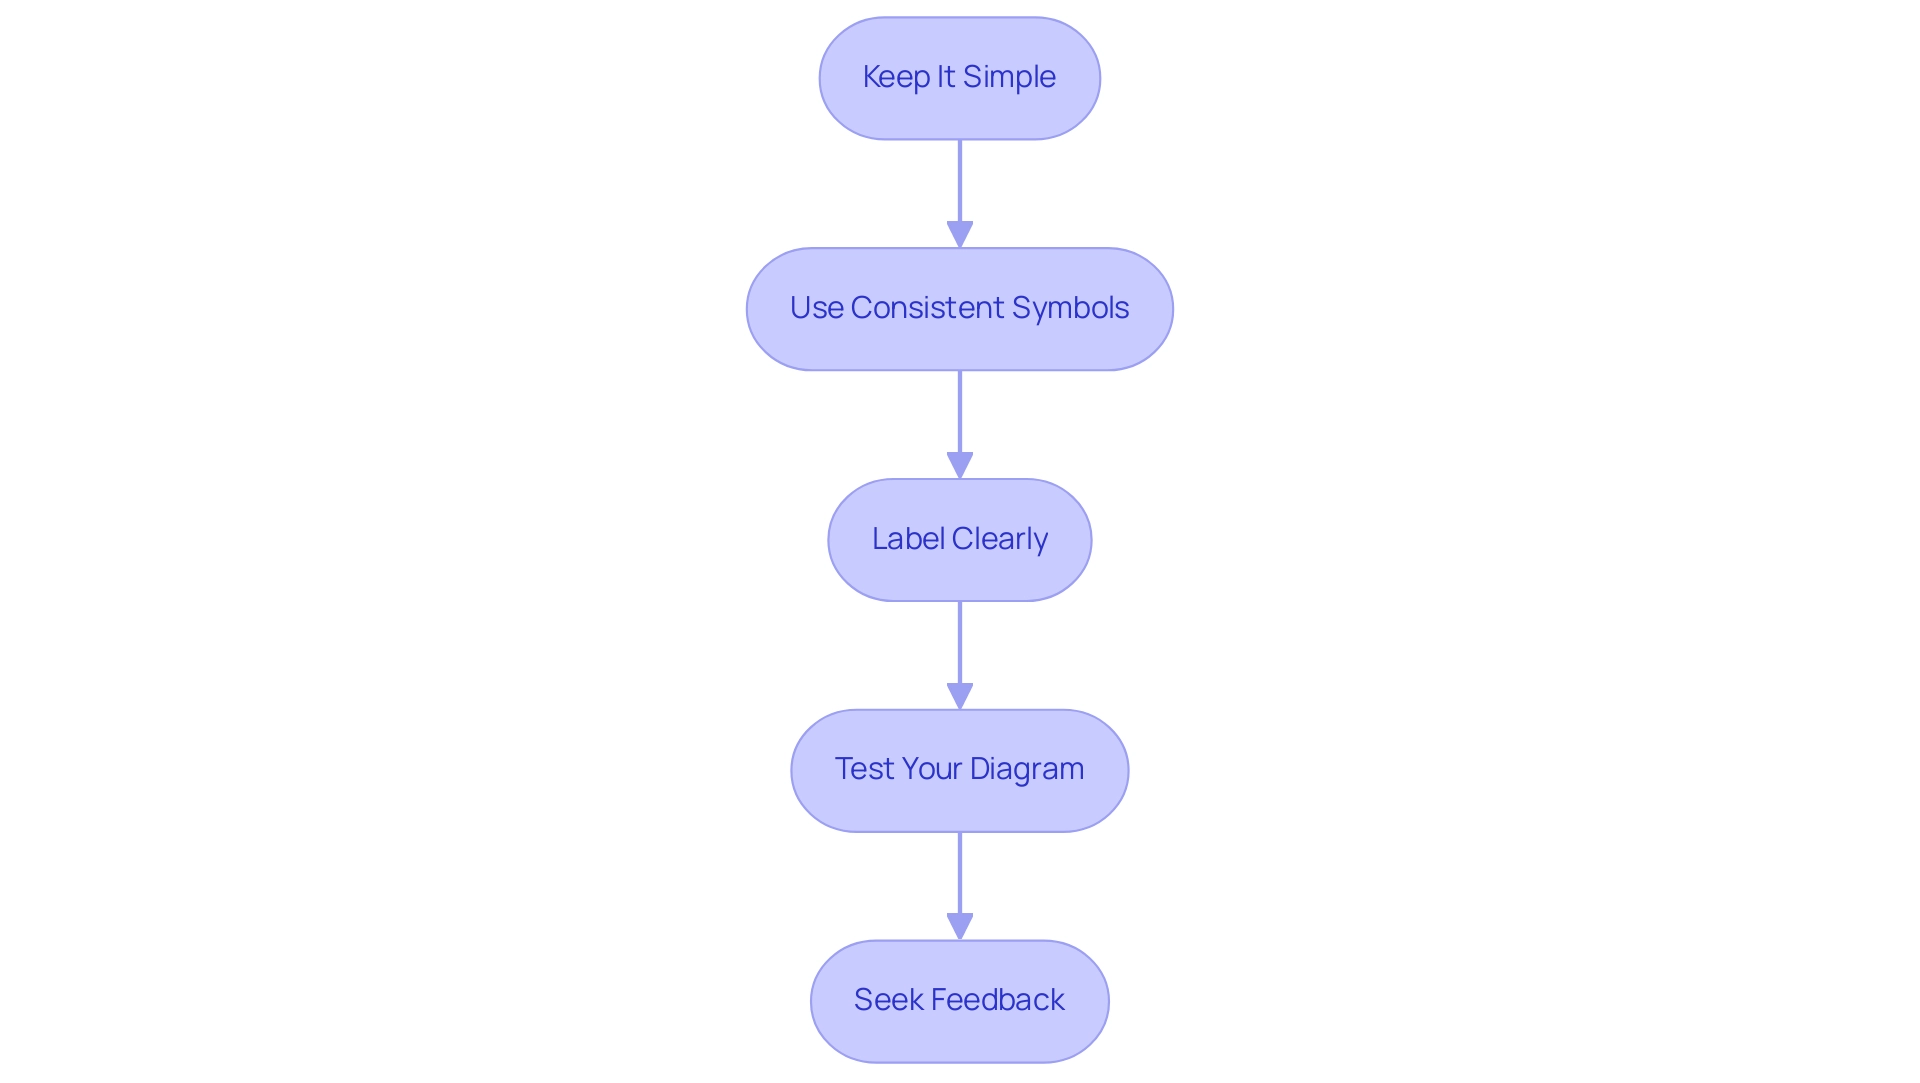
Keep It Simple: To ensure maximum clarity, avoid cluttering your diagram with excessive details. Focus on the main processes and decisions. Effective process mapping can significantly boost productivity and efficiency, which is essential for overall business success. Simplifying your diagram helps in maintaining a clear and understandable structure, crucial for identifying bottlenecks and ensuring a healthy workflow.
-
Use Consistent Symbols: Utilize standard diagram symbols consistently. This practice prevents misunderstanding and assists viewers in quickly understanding the diagram's reasoning. As Jonathan Ive aptly puts it,
Very often design is the most immediate way of defining what products become in people's minds.
Consistency in design is key to effective communication, ensuring that your diagram conveys its message clearly and effectively. -
Label Clearly: Clearly label all symbols with concise descriptions. This step is vital in enhancing comprehension and allows others to follow your logic without needing further explanations. Proper documentation of variations and exceptions is necessary to avoid risks in business operations, as highlighted in the case study regarding the failure to document such variations. This oversight can lead to significant operational risks and inefficiencies.
-
Test Your Diagram: Simulate executing the code represented by your diagram. Walking through your diagram can help identify logical errors or missing components. Inadequate data collection can lead to insufficient analysis, hampering your ability to make informed decisions. Therefore, thorough testing is crucial for accuracy and effectiveness.
-
Seek Feedback: Share your diagram with colleagues and solicit their input. External perspectives can highlight areas that may need clarification or improvement. Proper feedback mechanisms ensure that your flowchart is robust and serves its purpose efficiently, ultimately leading to better process outcomes.

Common Mistakes to Avoid
-
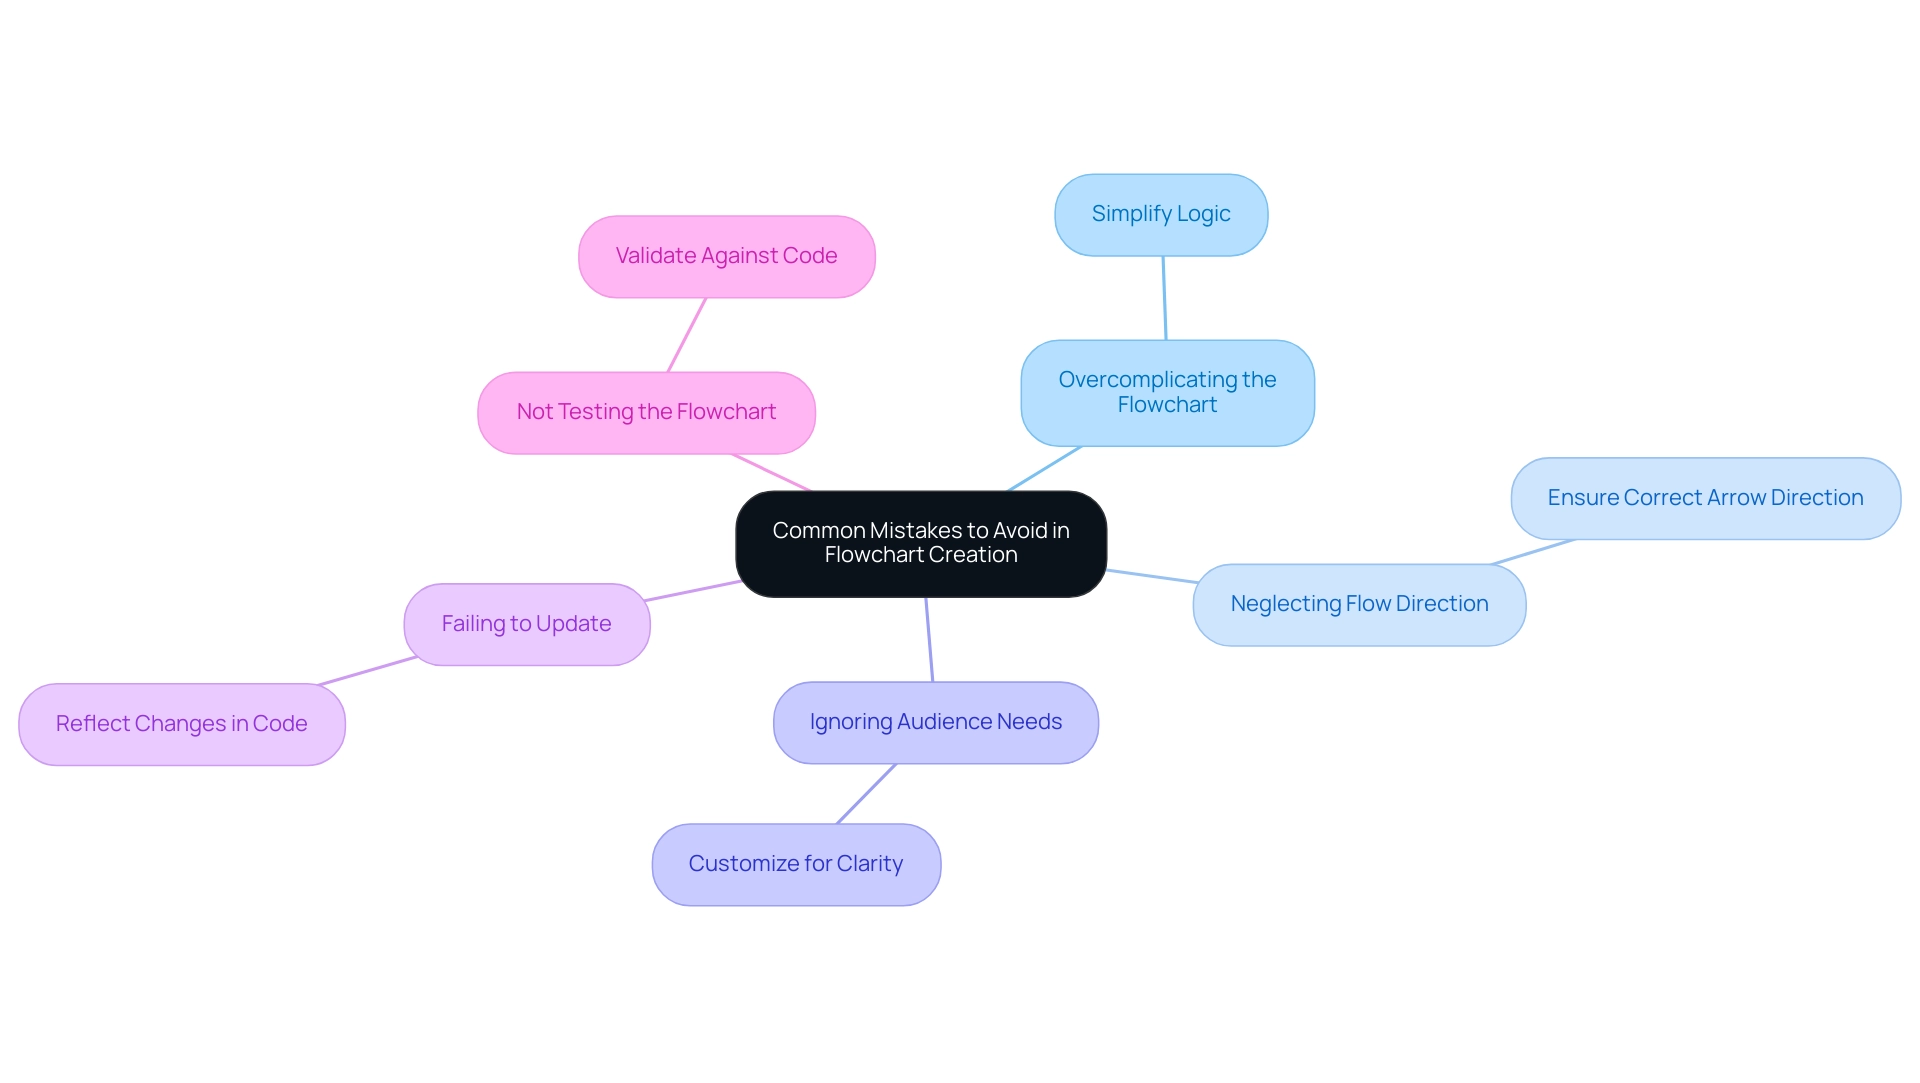
Overcomplicating the Flowchart: Many developers tend to include too much detail. Remember, the goal is to simplify the logic, not to replicate the entire code.
-
Neglecting Flow Direction: Ensure that all arrows point in the correct direction. Misleading flows can create confusion and misinterpretation.
-
Ignoring Audience Needs: Customize your diagram to the intended audience. What may be clear to you might not be clear to others.
-
Failing to Update: As code evolves, so should your flowcharts. Regularly update them to reflect changes in logic or structure to maintain their relevance and accuracy.
-
Not Testing the Flowchart: Skipping the testing phase can lead to logical errors being overlooked. Always validate your flowchart against the code it represents.

Conclusion
Transforming code into flowcharts is a pivotal strategy for enhancing understanding and efficiency in programming. By utilizing tools like Kodezi, developers can visualize complex logic, which not only aids in debugging but also streamlines communication among team members. The step-by-step guide provided illustrates the ease with which flowchart software can be employed, encouraging developers to break down their code into manageable components and represent them visually.
Adopting best practices in flowchart creation is essential for maximizing clarity and effectiveness. Keeping flowcharts simple, using consistent symbols, and providing clear labels are all strategies that contribute to better comprehension and collaboration. Additionally, soliciting feedback and rigorously testing flowcharts ensures that they accurately reflect the logic of the code, ultimately leading to more robust programming practices.
Avoiding common pitfalls such as overcomplication and neglecting audience needs is crucial for maintaining the utility of flowcharts. Regular updates to flowcharts, as code evolves, ensure that they remain relevant and useful. By embracing these techniques, developers can significantly enhance their coding efficiency, foster collaboration, and drive productivity in their projects.
The integration of flowcharting into programming practices not only clarifies thought processes but also empowers teams to deliver high-quality software solutions with confidence.
Frequently Asked Questions
What is the purpose of transforming scripts into flowcharts?
Transforming scripts into flowcharts helps visualize and comprehend programming logic, making it easier for developers to trace the flow of control and information within their programs.
How do flowcharts assist in programming?
Flowcharts provide a graphical representation of algorithms, which is especially beneficial for debugging, optimizing, and conveying functionality to team members or stakeholders.
What role do automated tools like Kodezi CLI play in programming?
Automated tools like Kodezi CLI facilitate rapid healing and debugging of codebases, identifying and fixing issues instantly while providing detailed explanations of the problems and their resolutions.
Can you give an example of the effectiveness of flowcharts in programming?
A study illustrated the usefulness of flow diagrams with complex structures, featuring 1000 nodes and 1997 directed edges, supporting the notion that flowcharts can effectively manage intricate programming logic.
What is the Structured Program Theorem, and how does it relate to flowcharts?
The Structured Program Theorem shows that any computation can be implemented using structured programming constructs, which supports the use of flowcharts by eliminating the need for goto statements.
What are some practical benefits of using flowcharts in software development?
Flowcharts can improve team cooperation, enhance comprehension of functionality, and assist developers in identifying inefficiencies and potential improvements in their code.
What are the steps to create an effective flowchart?
The steps include choosing the right flowchart software, importing or writing your program, identifying key components, designing the diagram using standard symbols, refining the diagram for clarity, and exporting it for sharing.
What best practices should be followed when creating flowcharts?
Best practices include keeping it simple, using consistent symbols, labeling clearly, testing the diagram, and seeking feedback from colleagues.
What common mistakes should be avoided when creating flowcharts?
Common mistakes include overcomplicating the flowchart, neglecting flow direction, ignoring audience needs, failing to update diagrams, and not testing the flowchart against the code it represents.


