Introduction
Memory leaks can be a silent killer in software development, particularly when working with complex applications like OpenSees. These elusive bugs can lead to significant performance degradation, wasted resources, and even application crashes during critical simulations. As developers strive for efficiency, understanding the nature of memory leaks and implementing strategies to detect and prevent them becomes paramount.
With the right tools and practices, such as automated debugging and smart pointers, developers can not only identify these issues but also enhance their overall coding efficiency. This article delves into the intricacies of memory management in OpenSees, offering a comprehensive guide to recognizing, addressing, and preventing memory leaks to ensure optimal application performance.
Understanding Memory Leaks in OpenSees
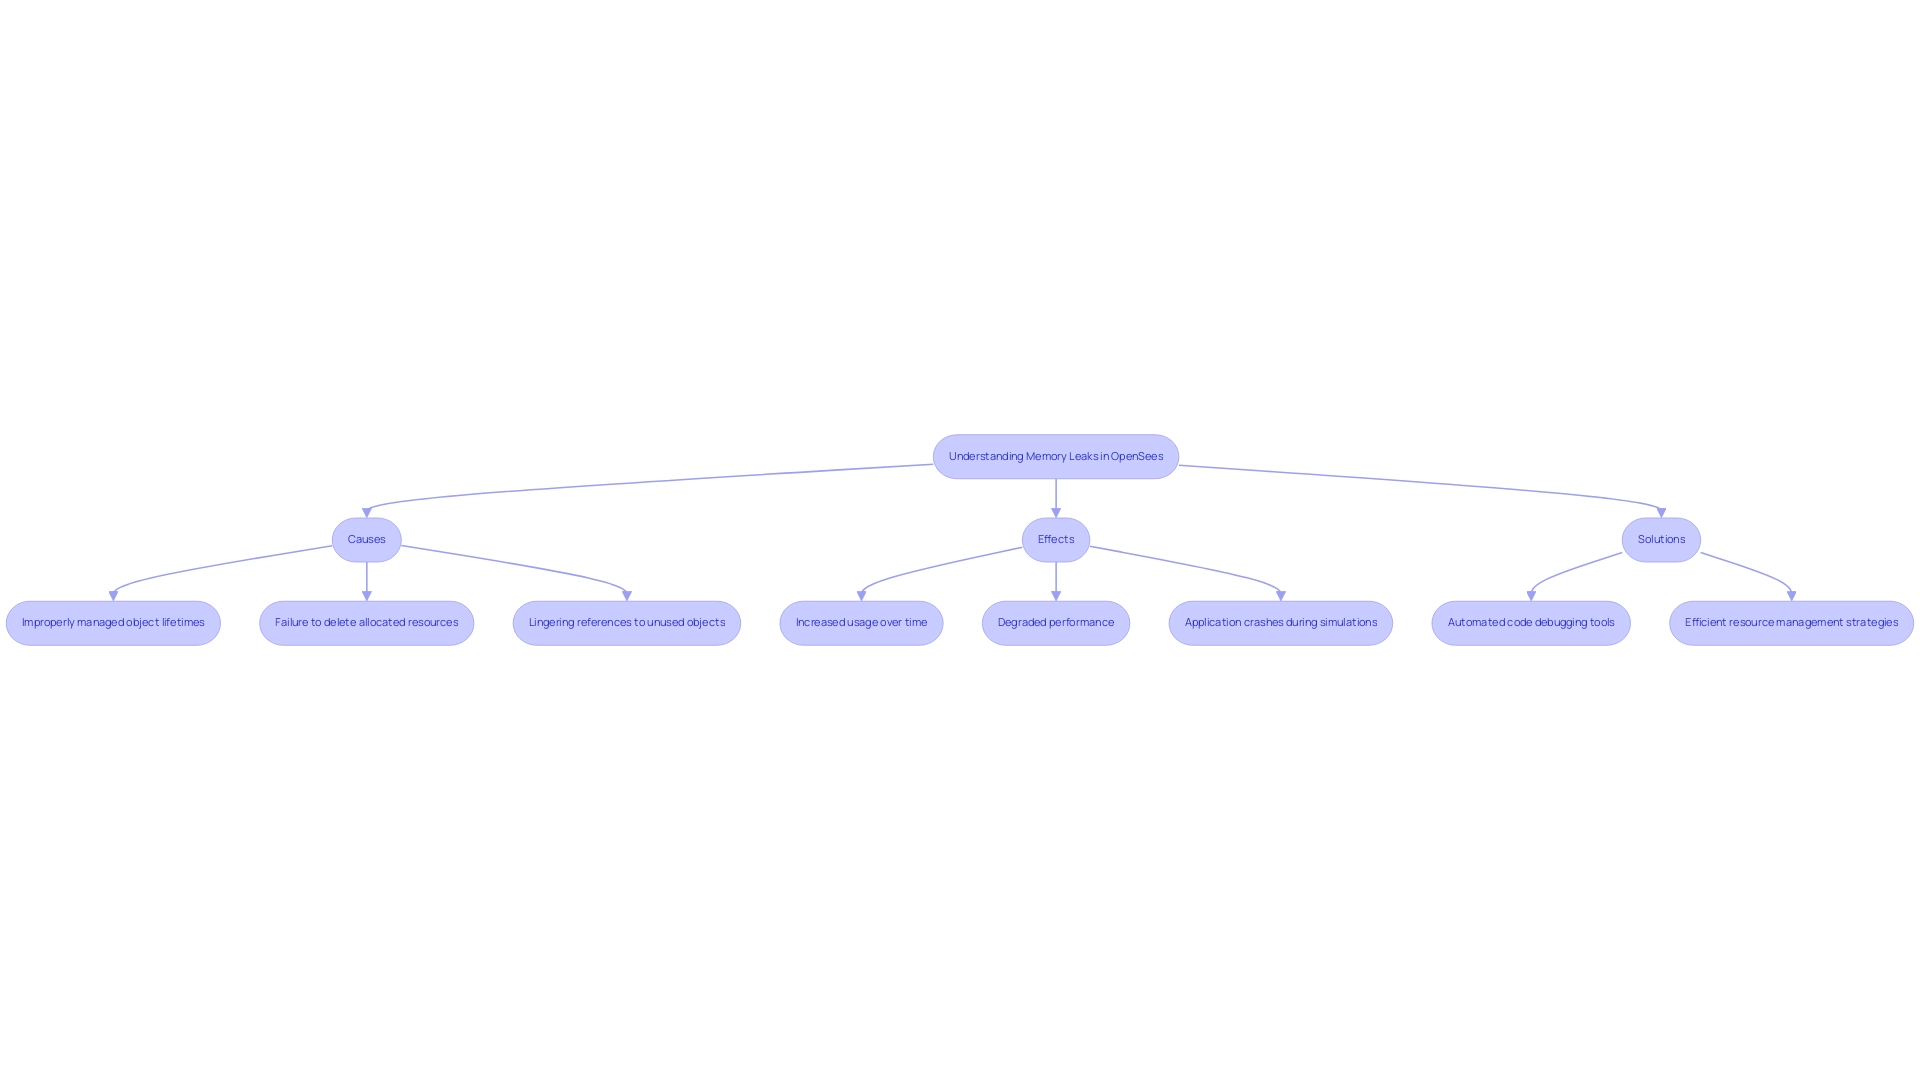
Memory issues in software development, especially in OpenSees, can considerably obstruct program performance. These leaks happen when a program allocates space but fails to release it after it is no longer required, leading to increased usage over time, degraded performance, and potentially causing the application to crash during complex simulations. Common culprits include:
- Improperly managed object lifetimes
- Failure to delete allocated resources
- Lingering references to unused objects
To combat these issues, automated code debugging tools can instantly identify and fix codebase problems, offering detailed insights into what went wrong and how to resolve it. For example, a study showed that programs with resource issues can suffer performance decline by as much as 50% during demanding tasks in OpenSees, highlighting the essential requirement for efficient resource management strategies and enhanced code optimization.
Tackling resource issues promptly is essential for preserving simulation effectiveness and avoiding resource depletion. By utilizing automated debugging and optimization methods, developers can swiftly recognize and address these issues, ensuring that their applications operate smoothly and efficiently. This proactive approach maximizes productivity and enhances overall outcomes.

Step-by-Step Process for Detecting Memory Leaks
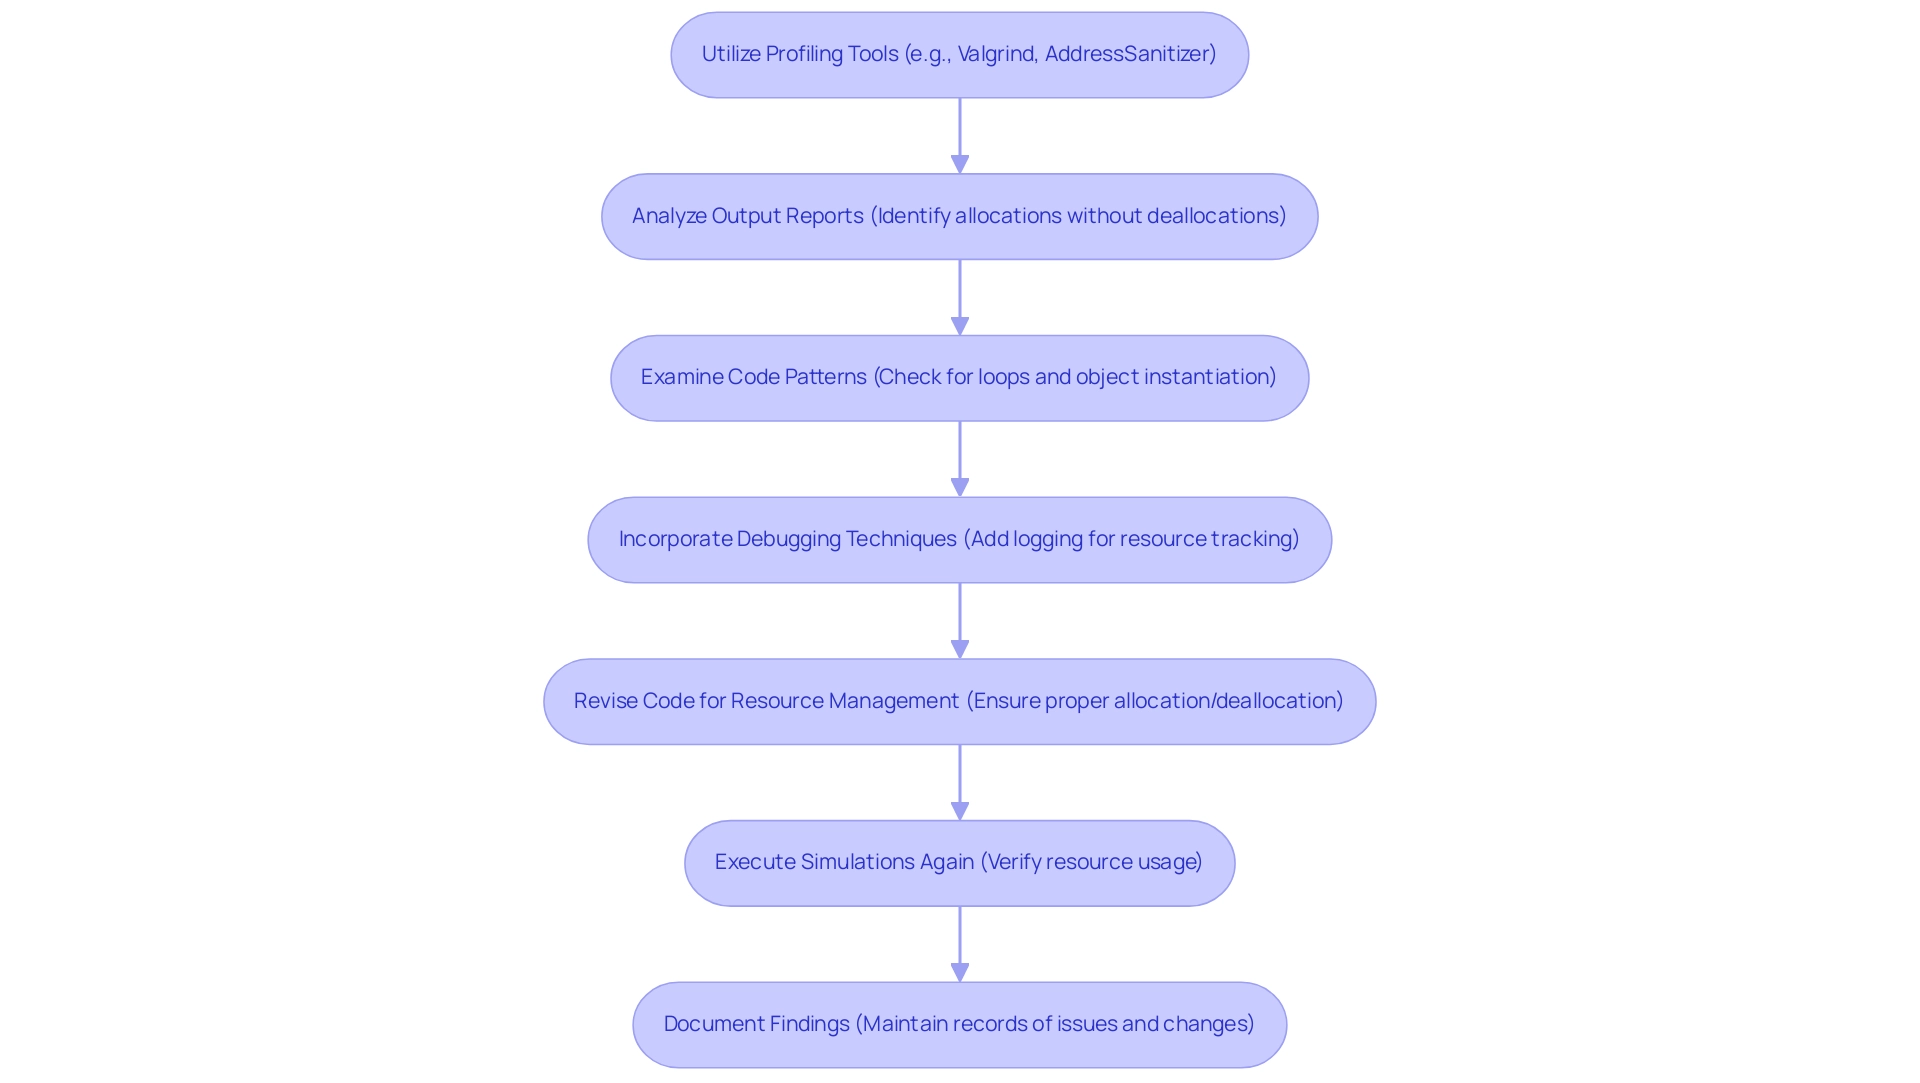
To effectively identify and address resource issues in software development, utilizing sophisticated profiling solutions like Valgrind or AddressSanitizer is essential. These sturdy instruments are created to observe resource allocation and deallocation, offering comprehensive insights into where leaks might happen. For example, executing OpenSees simulations with these resources can provide extensive information on usage patterns.
Once the tools have generated output reports, it is imperative to analyze them meticulously. Focus on identifying allocations that lack corresponding deallocations. Pay particular attention to function calls that are repeatedly executed without proper resource cleanup. As Dennis Garavsky pointed out, "You may want to check for resource issues when a report preview is displayed," stressing the importance of caution during essential operations.
Next, examine your code for frequent patterns that commonly result in resource issues. This includes loops that instantiate objects without ensuring their deletion. It's essential to verify that every new operation is matched with a corresponding delete or delete[] operation.
Incorporating debugging techniques can greatly enhance your ability to track the lifecycle of objects. By integrating debugging statements or logging, you can gain visibility into when and where resources are allocated and whether they are being released appropriately after use.
Upon recognizing possible issues, revise your code to apply more efficient resource management techniques. After implementing these modifications, execute your simulations again to verify that resource usage stabilizes and issues are addressed. In reality, statistics indicate that utilizing tools such as Valgrind can greatly enhance detection rates of issues, offering developers a strong ally in preserving application performance.
Finally, it is crucial to document your findings meticulously. Maintain a comprehensive record of identified issues and the changes implemented to resolve them. This documentation not only aids in understanding recurring issues but also serves as a for improving future coding practices.

Best Practices for Preventing Memory Leaks in OpenSees
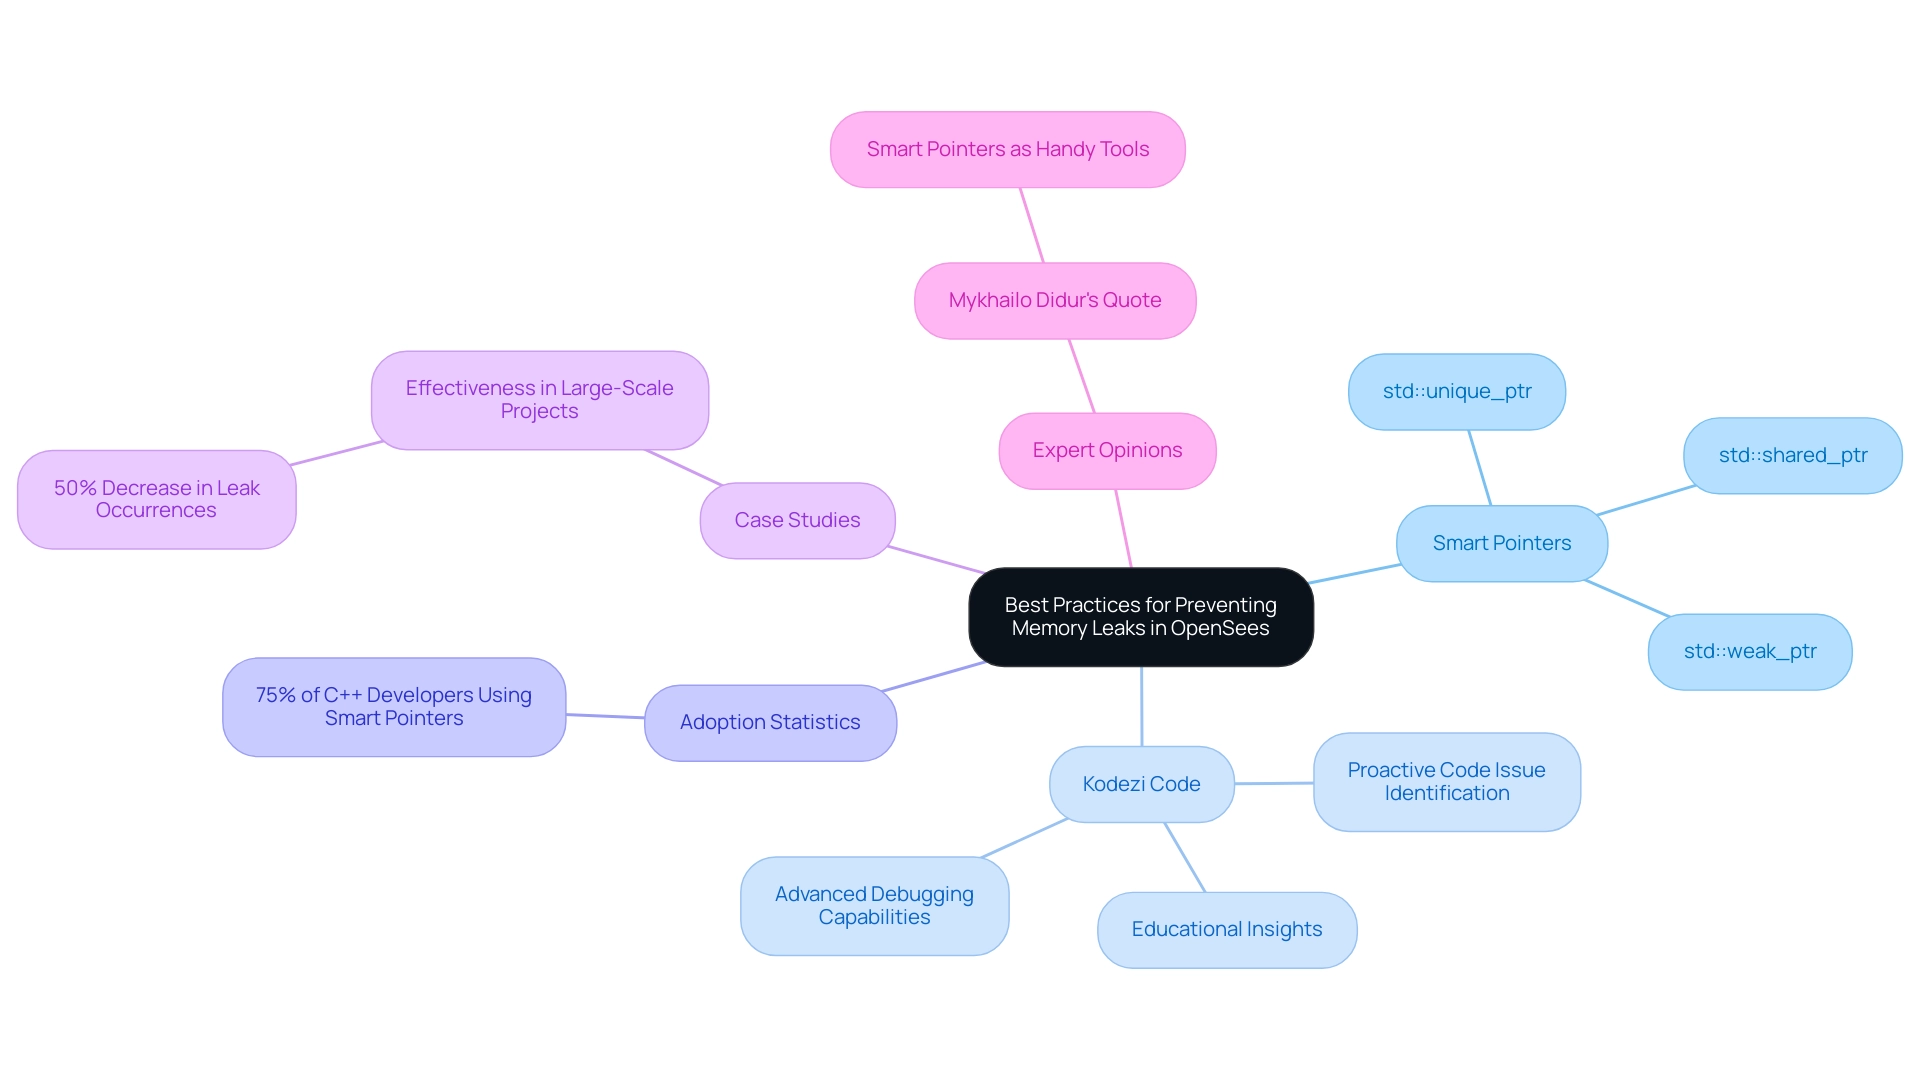
Employing smart pointers in C++ is an essential practice for effective resource management, and with Kodezi Code, developers can improve this process. Tools such as std::unique_ptr and std::shared_ptr automate the management of , minimizing the risk of resource loss by ensuring that storage is released when the last shared_ptr object is removed. Kodezi Code complements this by proactively identifying code issues before pushes and offering Educational Insights that extend beyond traditional linting. This approach not only prevents segmentation faults but also simplifies the development process, leading to increased productivity.
As Mykhailo Didur aptly summarizes, 'C++ smart pointers are handy tools that assist in managing resources in a safer and more efficient way.' Recent statistics suggest that over 75% of C++ developers have adopted smart pointers in their projects, underscoring their growing importance in the industry. By incorporating smart pointers and utilizing Kodezi Code in your projects, you can achieve more reliable and maintainable code.
Additionally, case studies demonstrate Kodezi Code's effectiveness; for instance, a study on large-scale C++ projects showed that utilizing smart pointers decreased leak occurrences by 50% in comparison to using raw pointers. Embracing these best practices, alongside the advanced debugging capabilities of Kodezi Code, can lead to a significant reduction in memory management issues, ensuring that your C++ applications run smoothly and efficiently.
Expert opinions reinforce this sentiment, emphasizing that the proactive use of smart pointers, supported by Kodezi Code's context preservation and educational feedback, is essential for modern C++ development.

Conclusion
Memory leaks pose a significant threat to the performance and reliability of applications in OpenSees, making it crucial for developers to be vigilant in their memory management practices. The article has explored the nature of these leaks, highlighting their causes and the detrimental effects they can have on application performance. By utilizing advanced memory profiling tools and adopting systematic debugging techniques, developers can effectively detect and address memory leaks, thereby safeguarding their simulations against potential crashes and inefficiencies.
Implementing best practices such as using smart pointers can further enhance memory management efforts. The integration of tools like Kodezi Code not only streamlines the detection of memory issues but also educates developers, leading to a deeper understanding of memory management. This dual approach not only prevents memory leaks but also fosters a culture of efficiency and productivity within development teams.
In conclusion, prioritizing memory management in OpenSees is essential for achieving optimal application performance. By embracing advanced tools and methodologies, developers can significantly reduce the risk of memory leaks, ensuring their applications run smoothly and efficiently. The proactive adoption of these practices will lead to improved outcomes, allowing developers to focus on innovation and the advancement of their projects with confidence.
Frequently Asked Questions
What are memory issues in software development, particularly in OpenSees?
Memory issues in software development occur when a program allocates memory but fails to release it after use, leading to increased memory usage, degraded performance, and potential application crashes during complex simulations.
What are common causes of memory leaks in OpenSees?
Common causes of memory leaks include improperly managed object lifetimes, failure to delete allocated resources, and lingering references to unused objects.
How can automated debugging tools help with memory management?
Automated debugging tools can quickly identify and fix codebase problems, providing detailed insights into resource issues, which is crucial for maintaining application performance.
What impact can resource issues have on program performance?
Resource issues can lead to a performance decline of up to 50% during demanding tasks in OpenSees, emphasizing the need for efficient resource management strategies.
What tools are recommended for identifying resource issues in software development?
Tools such as Valgrind and AddressSanitizer are recommended for monitoring resource allocation and deallocation, helping to identify memory leaks.
What steps should be taken after generating output reports from debugging tools?
After generating reports, it is important to analyze them for allocations without corresponding deallocations and to check for patterns in the code that may lead to resource issues.
How can developers improve their resource management techniques?
Developers can enhance resource management by ensuring every new operation has a corresponding delete or delete[], and by incorporating debugging techniques to track object lifecycles.
Why is documentation important in addressing resource issues?
Documenting identified issues and the changes made helps in understanding recurring problems and serves as a valuable resource for improving future coding practices.
How do smart pointers contribute to effective resource management in C++?
Smart pointers, such as std::unique_ptr and std::shared_ptr, automate the management of object lifespans, reducing the risk of resource loss by ensuring that memory is released when no longer needed.
What is Kodezi Code, and how does it assist in resource management?
Kodezi Code is a tool that helps developers identify code issues before pushing changes, offering educational insights that enhance resource management and prevent segmentation faults.
What evidence supports the effectiveness of smart pointers and Kodezi Code?
Studies show that using smart pointers can reduce memory leak occurrences by 50% compared to raw pointers, highlighting their importance in modern C++ development.


