Introduction
In the dynamic landscape of software development, ensuring optimal performance and security is paramount for any Go application. Enter dd trace go, a powerful library that facilitates distributed tracing, allowing developers to monitor and analyze the flow of requests across services. This tool not only uncovers performance bottlenecks but also enhances the overall efficiency of applications.
When combined with Kodezi's robust suite of developer tools, which streamline code debugging and performance optimization, teams can achieve a seamless integration that elevates their development process. By embracing these innovative solutions, Go developers can unlock valuable insights, automate tedious tasks, and maintain high standards of code quality—all essential for thriving in today's competitive environment.
Introduction to dd trace go: Enhancing Go Applications with Datadog
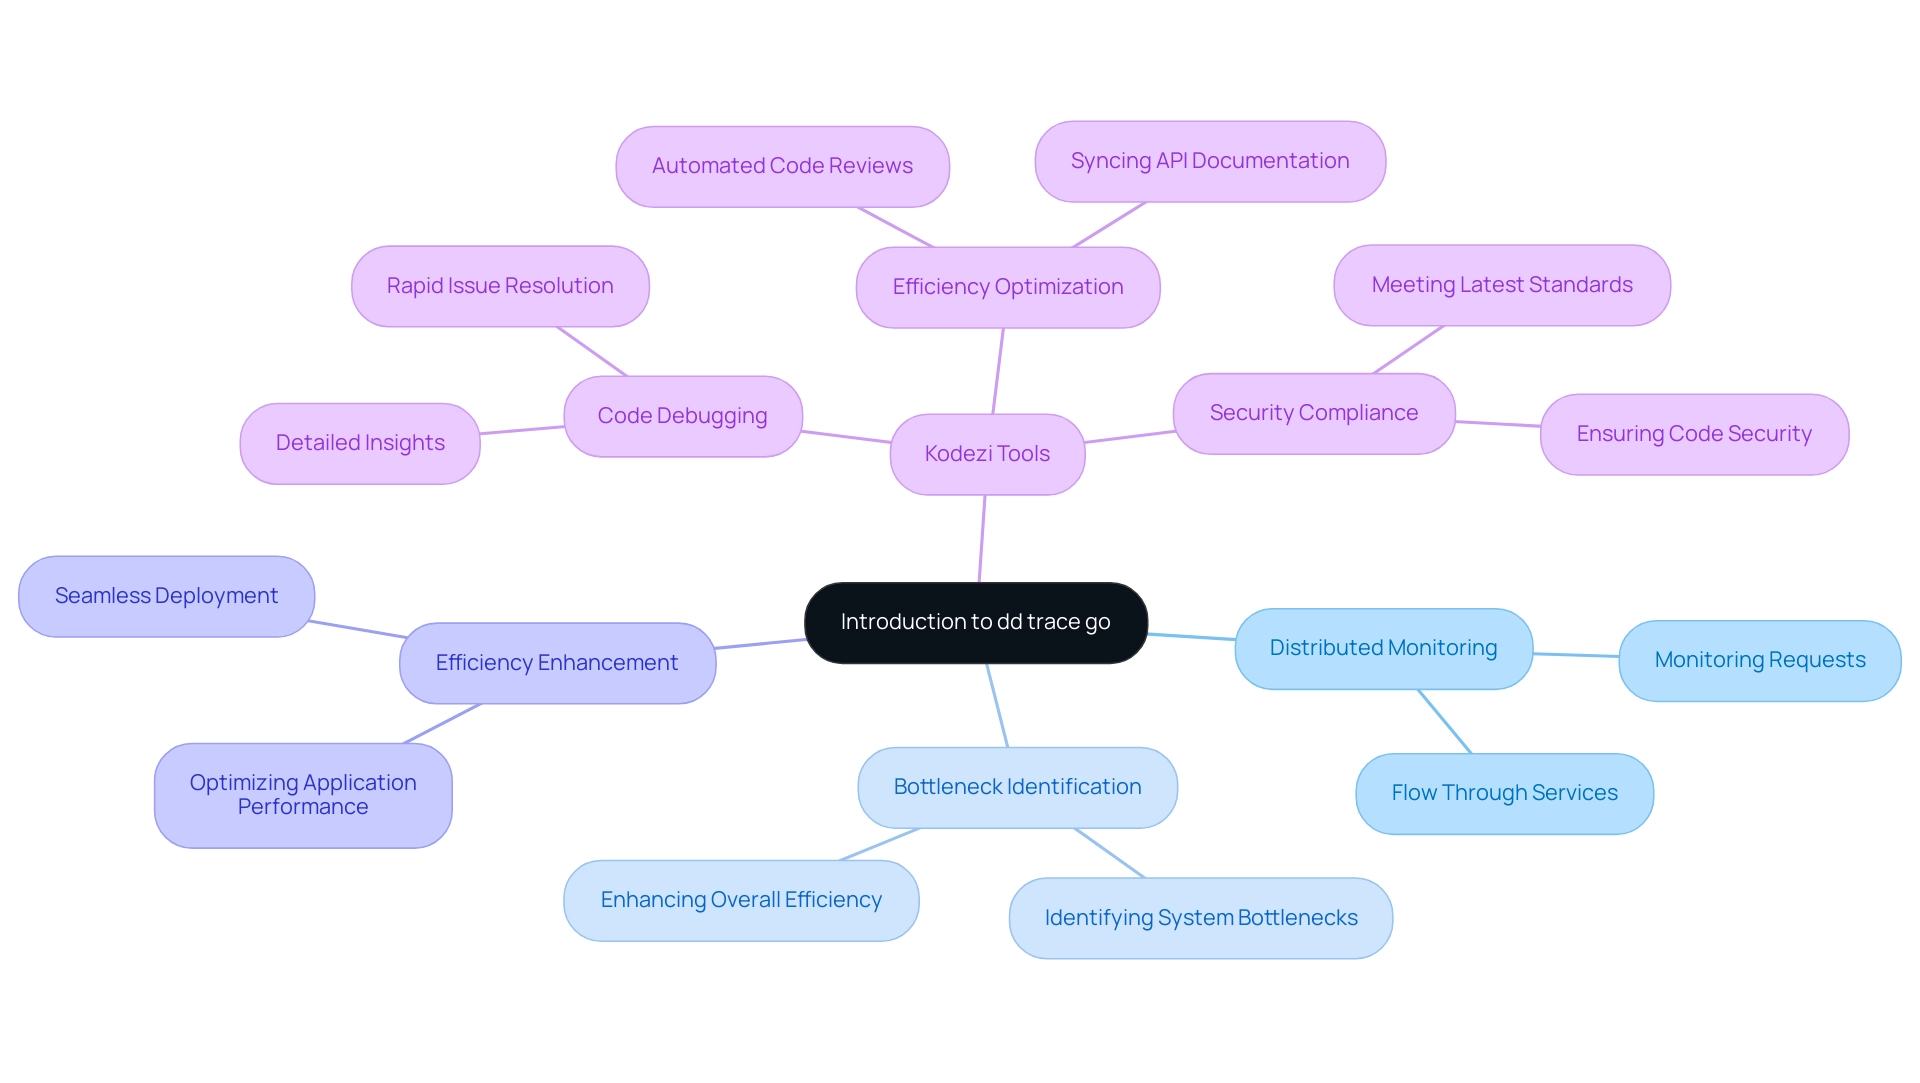
The Go library dd trace go was created to enhance distributed monitoring for platforms utilizing Datadog. By allowing creators to monitor requests as they flow through different services, dd trace go empowers teams to gain insights into their systems' functionality, assisting in identifying bottlenecks and enhancing overall efficiency. In conjunction with Kodezi's collection of programming tools, which automates code debugging, efficiency optimization, and security compliance, programmers can ensure their codebase meets the latest standards while simplifying the deployment process.
Kodezi tools provide detailed insights and explanations for code issues, allowing for rapid identification and resolution of problems. Moreover, with Kodezi CLI, you can effortlessly integrate tracing into your Go software, automate code reviews, and keep API documentation in sync with code changes, all while ensuring seamless deployment of updates. Understanding how to implement these tools is essential for any Go developer aiming to optimize their application and maintain high standards of performance and security.
Implementing dd trace go: Step-by-Step Guide with Code Examples
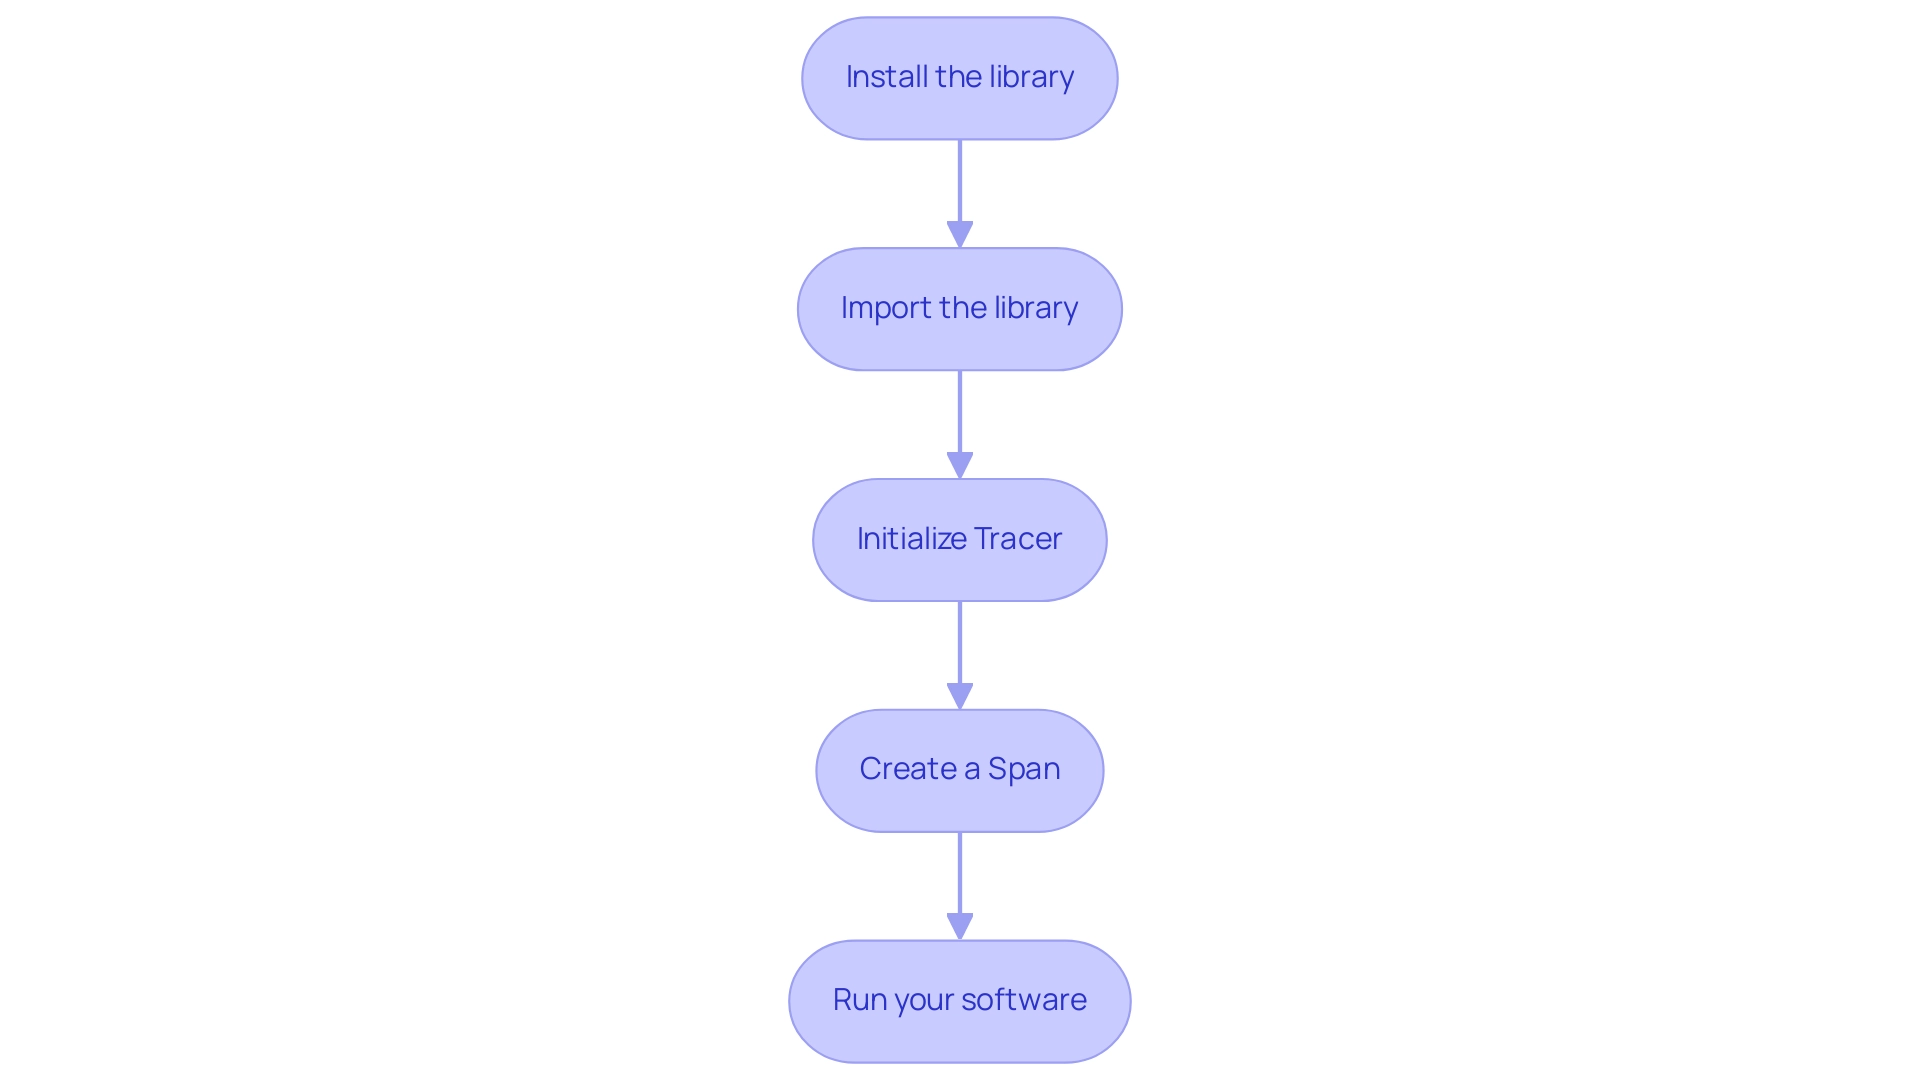
To implement dd trace go, follow these steps:
-
Install the library: Add the dd trace go library to your project by running:
go get gopkg.in/DataDog/dd-trace-go.v1 -
Import the library: In your Go file, import the library with:
import "gopkg.in/DataDog/dd-trace-go.v1/ddtrace" -
Initialize Tracer: Before you start tracing, initialize the tracer as follows:
import "gopkg.in/DataDog/dd-trace-go.v1/ddtrace/tracer" func main() { tracer.Start() defer tracer.Stop() } -
Create a Span: To track specific operations, create a span:
func someFunction() { span := tracer.StartSpan("some.operation") defer span.Finish() } -
Run your software: With the tracer running, you can now monitor the performance of your software in Datadog.
By following these steps, you effectively set up dd trace go, which enhances observability in your Go applications.
Best Practices and Troubleshooting for dd trace go Integration
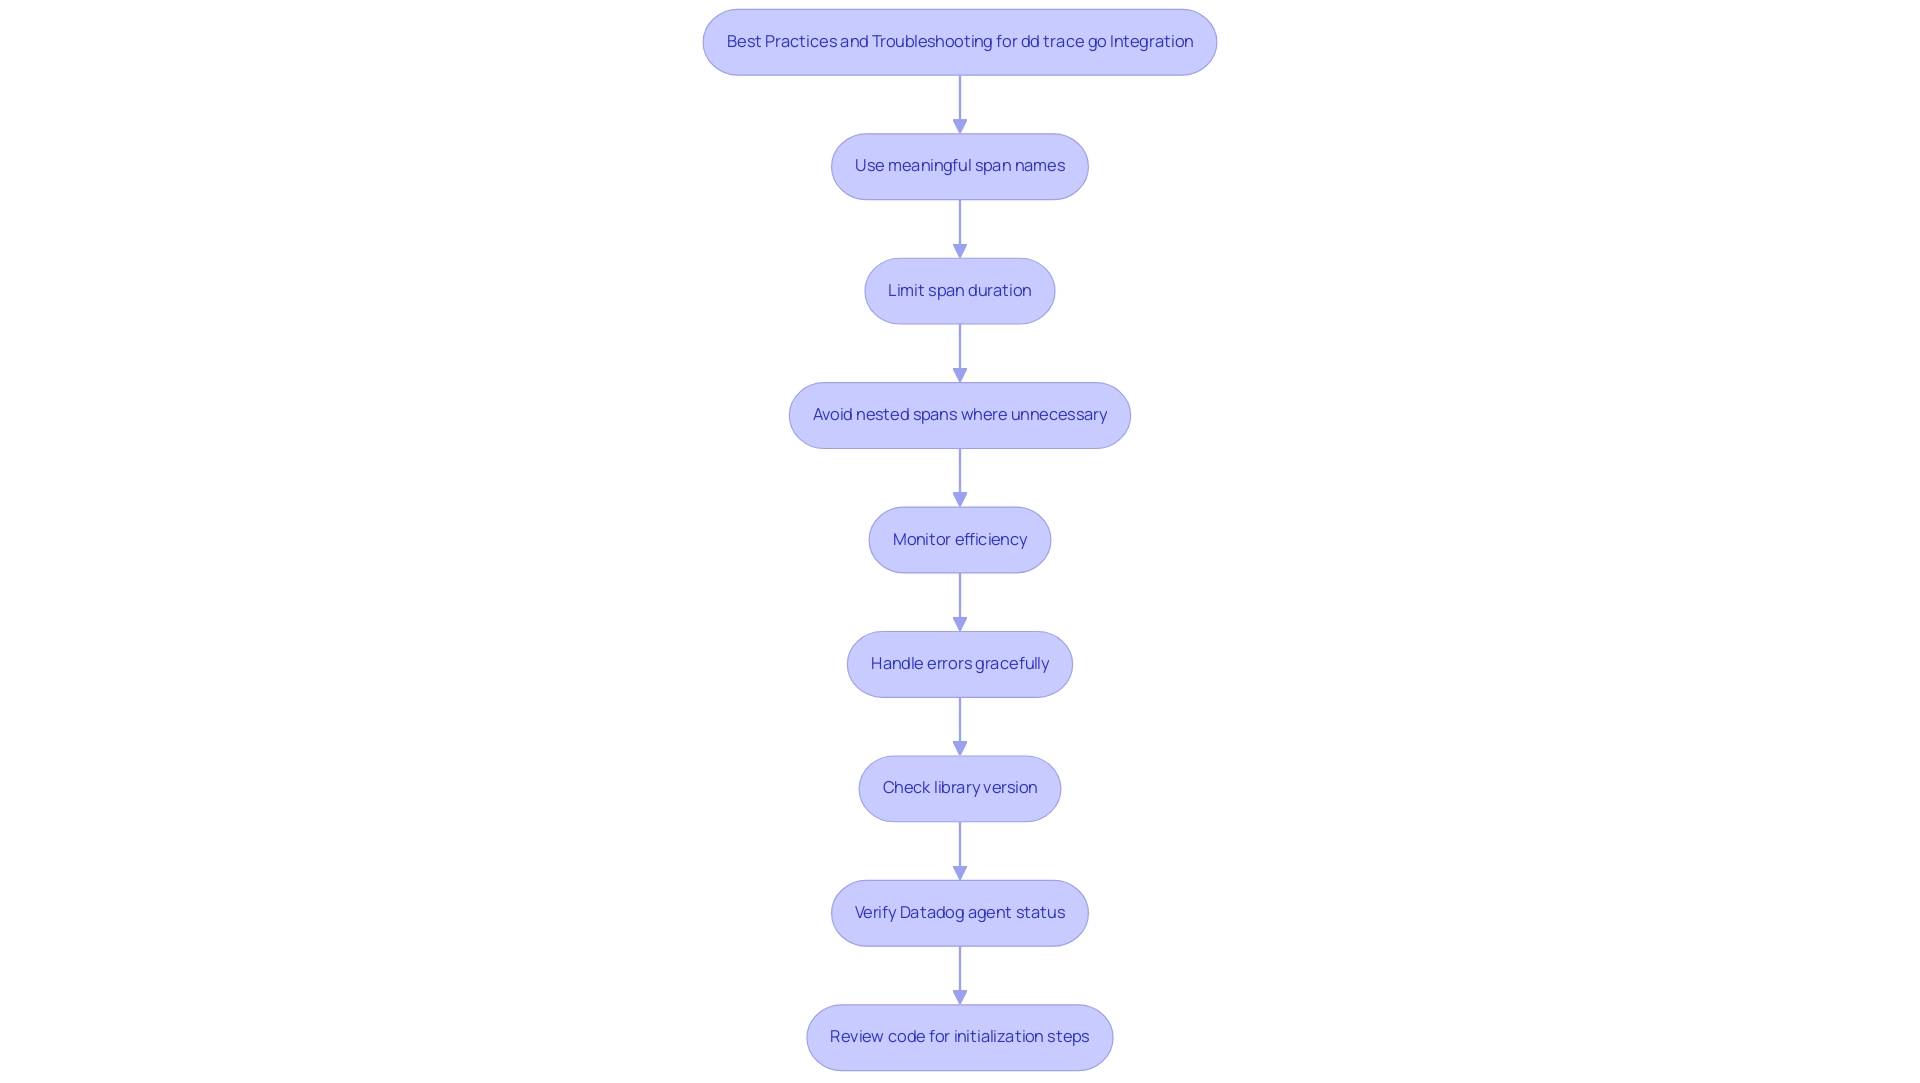
To ensure a successful integration of dd trace go, consider the following best practices:
-
Use meaningful span names: Give spans descriptive names that reflect their purpose, making it easier to analyze data later.
-
Limit span duration: Ensure spans are kept as short as possible to avoid excessive overhead and enhance efficiency.
-
Avoid nested spans where unnecessary: While nesting spans can provide detailed insights, it may also complicate visualization. Use them judiciously.
-
Monitor efficiency: Regularly assess the functionality of your software after integration to identify any possible slowdowns.
-
Handle errors gracefully: Ensure that any errors within spans are properly logged and reported to facilitate easier debugging.
If you encounter issues during integration, check the following:
- Ensure that you have the correct version of the library installed.
- Verify that the Datadog agent is running and properly set up to receive data.
- Review your code for any overlooked initialization steps or misconfigurations.
The Impact of dd trace go on Performance Monitoring and Security
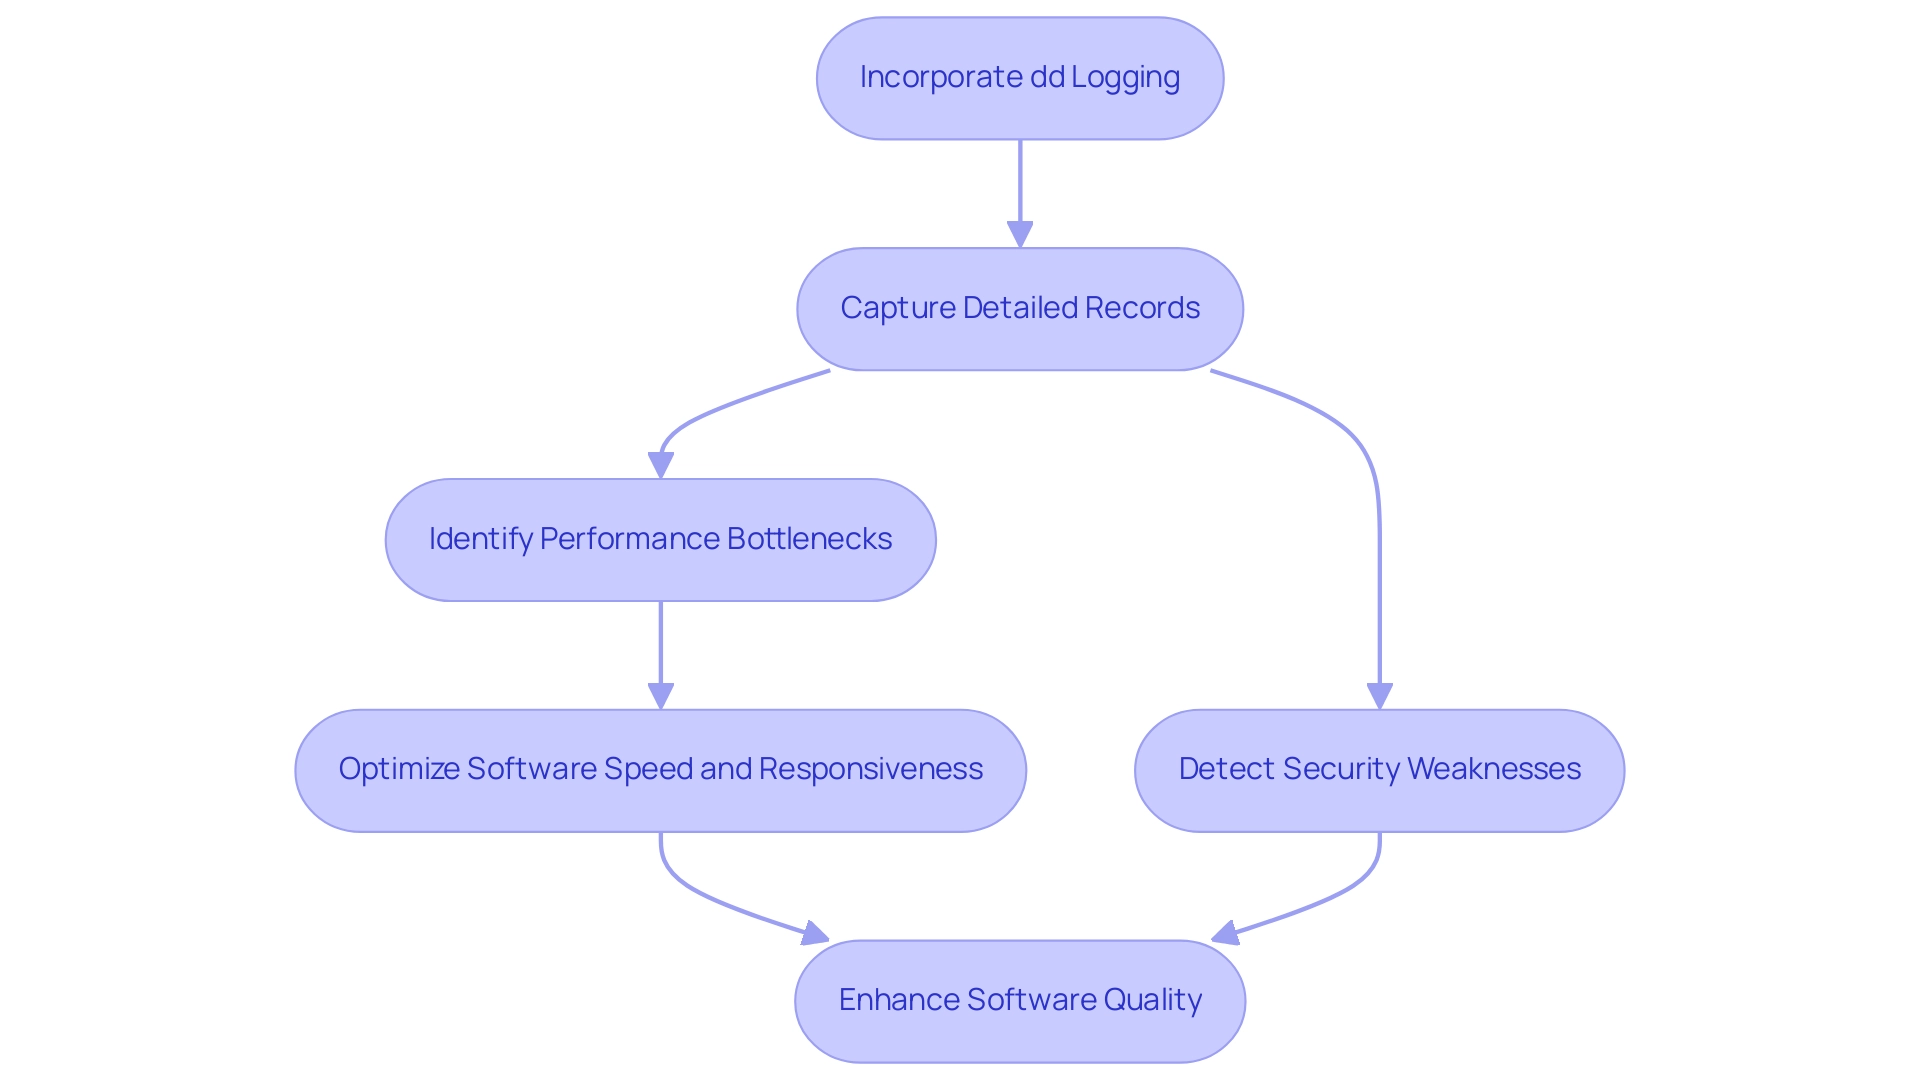
Incorporating dd logging into your Go programs greatly improves monitoring and security. By capturing detailed records, developers can identify performance bottlenecks, resulting in informed optimizations that improve software speed and responsiveness. Furthermore, dd monitoring assists in detecting security weaknesses by observing how data moves through the system.
Identifying and tackling these vulnerabilities is essential for preserving a secure software environment. Overall, the insights offered by dd enhance programmers' ability to produce higher quality, more secure software.
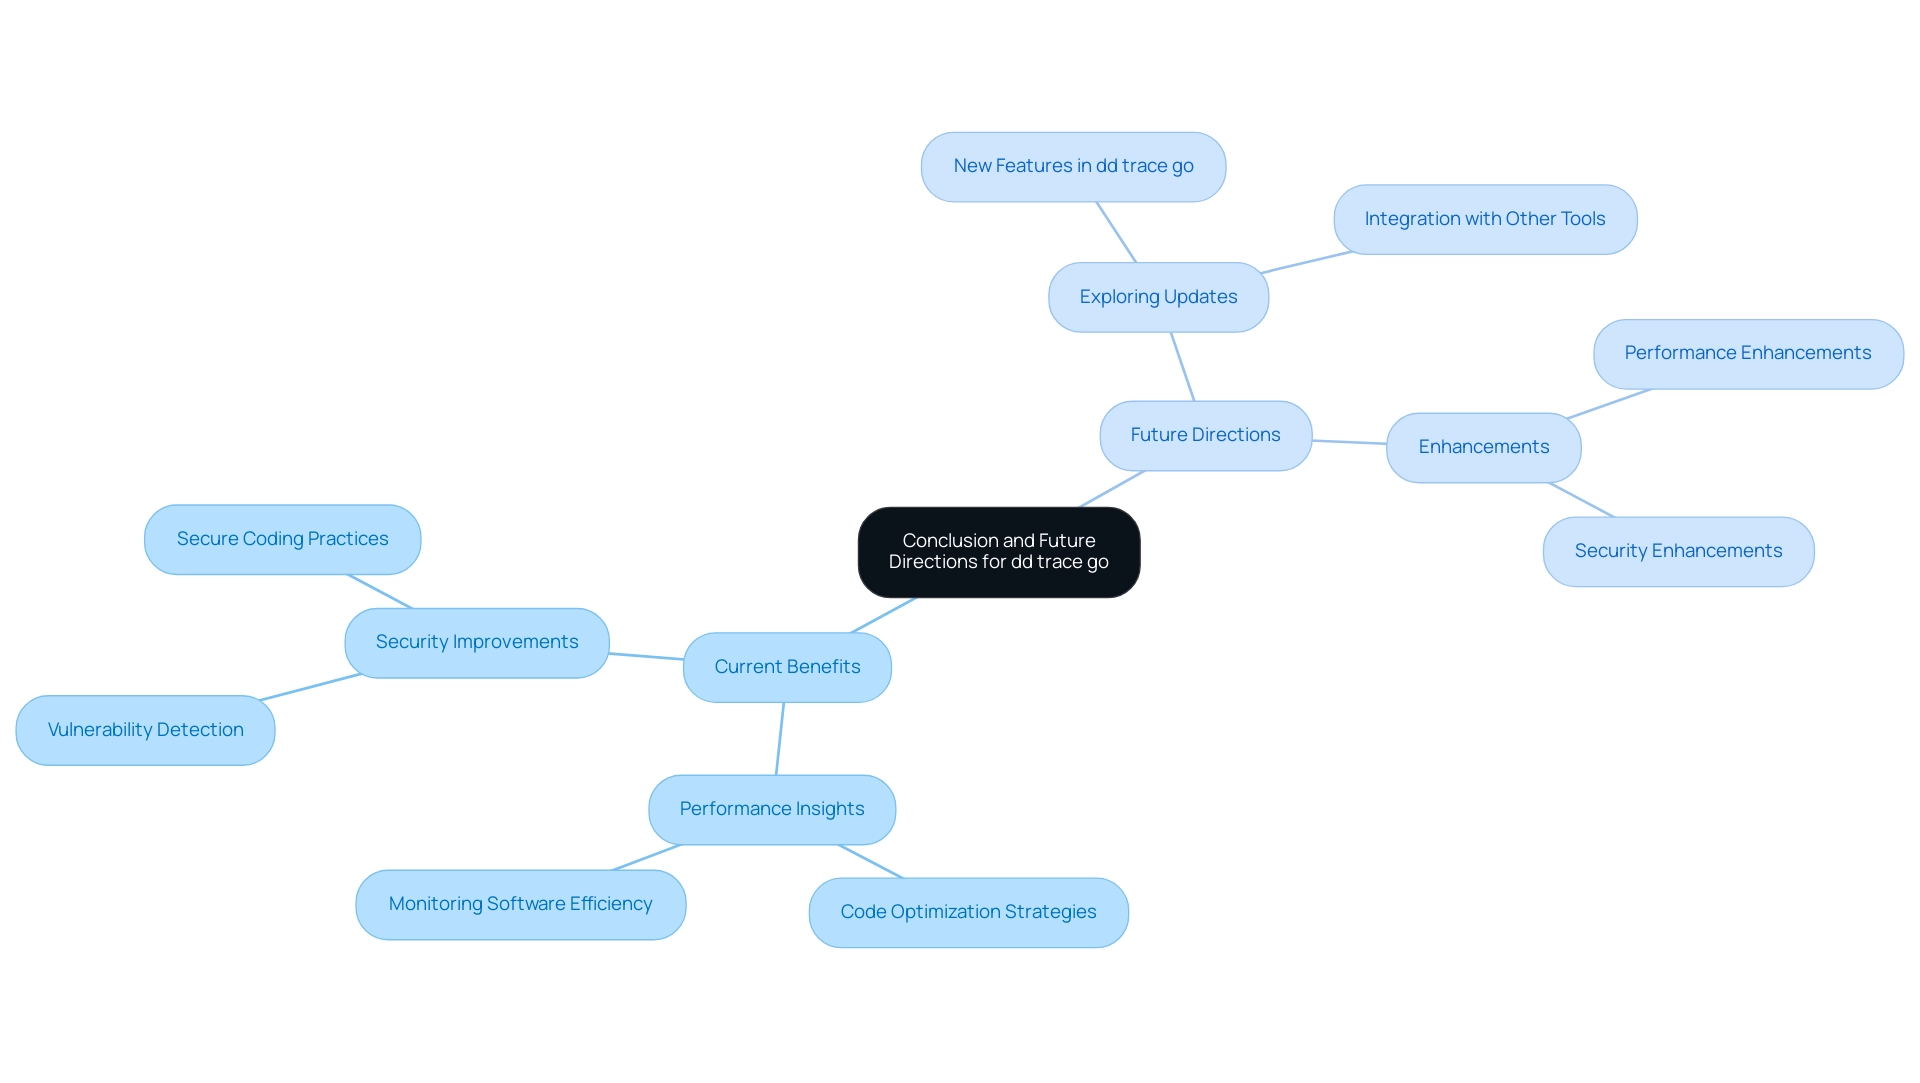
Conclusion and Future Directions for dd trace go in Go Development
In summary, dd monitor go is an invaluable resource for Go programmers aiming to improve their software's performance and security. By applying the strategies detailed in this tutorial, programmers can gain deeper insights into their software and optimize their codebases effectively. As the landscape of application development changes, staying informed with tools like dd go will be vital for ensuring that applications remain efficient and secure.
Moving forward, developers should continue exploring updates and enhancements related to dd trace go in order to leverage its full potential in their projects.
Conclusion
Integrating dd trace go into Go applications represents a transformative step towards elevating performance and security. By enabling detailed monitoring of request flows, developers can swiftly identify performance bottlenecks and optimize their applications for better responsiveness. Coupled with Kodezi's suite of developer tools, the process of debugging and ensuring code quality becomes streamlined, allowing teams to focus on innovation rather than routine maintenance.
The implementation of best practices in using dd trace go not only enhances observability but also fosters a proactive approach to identifying security vulnerabilities. This dual focus on performance and security ensures that applications are not only fast but also resilient against potential threats. As the development landscape continues to evolve, the adoption of such powerful tools becomes imperative for maintaining competitive edge.
Ultimately, embracing dd trace go and Kodezi's capabilities empowers Go developers to unlock new levels of efficiency and productivity. By continuously seeking out updates and advancements in these tools, development teams can ensure their applications are not only high-performing but also aligned with the latest standards in security and efficiency. The future of Go development is bright, and with the right tools in hand, developers are well-equipped to meet the challenges ahead.
Frequently Asked Questions
What is dd trace go and its purpose?
dd trace go is a library created to enhance distributed monitoring for platforms using Datadog. It allows users to monitor requests as they flow through different services, helping teams gain insights into system functionality, identify bottlenecks, and improve overall efficiency.
How do Kodezi tools complement dd trace go?
Kodezi's programming tools automate code debugging, optimize efficiency, and ensure security compliance, allowing programmers to maintain high standards in their codebase while simplifying the deployment process.
What are the steps to implement dd trace go?
To implement dd trace go, follow these steps: 1. Install the library using go get gopkg.in/DataDog/dd-trace-go.v1. 2. Import the library in your Go file with import "gopkg.in/DataDog/dd-trace-go.v1/ddtrace". 3. Initialize the tracer in your main function using tracer.Start() and defer tracer.Stop(). 4. Create a span to track specific operations with span := tracer.StartSpan("some.operation") and defer span.Finish(). 5. Run your software to monitor performance in Datadog.
What are some best practices for integrating dd trace go?
Best practices include: 1. Use meaningful span names for easier data analysis. 2. Limit span duration to enhance efficiency. 3. Avoid unnecessary nested spans to simplify visualization. 4. Regularly monitor software functionality post-integration. 5. Handle errors within spans properly to facilitate debugging.
What troubleshooting steps should be taken if issues arise during integration?
If issues occur, ensure you have the correct library version installed, verify that the Datadog agent is running and set up properly, and review your code for any overlooked initialization steps or misconfigurations.
How does dd logging improve monitoring and security in Go programs?
dd logging captures detailed records that help developers identify performance bottlenecks and optimize software speed and responsiveness. It also assists in detecting security weaknesses by monitoring data movement through the system, which is crucial for maintaining a secure software environment.
Why is dd monitor go important for Go programmers?
dd monitor go is vital for Go programmers as it helps improve software performance and security. By utilizing the strategies outlined, developers can gain deeper insights into their applications, optimize codebases, and stay informed about updates to ensure efficiency and security in their projects.


