Introduction
In the intricate world of software development, debugging stands as a cornerstone of quality assurance, ensuring that applications not only function as intended but also deliver a seamless user experience. With nearly half of software project budgets often consumed by error correction, the importance of effective debugging strategies cannot be overstated.
As developers strive for efficiency, tools like Kodezi CLI emerge as game-changers, revolutionizing the debugging landscape by automating error detection and resolution. By embracing advanced debugging techniques and integrating innovative solutions into their workflows, engineering teams can significantly enhance productivity, reduce troubleshooting time, and ultimately elevate software quality.
This article delves into the essentials of debugging, explores various tools and techniques, and highlights how Kodezi can empower developers to achieve remarkable outcomes in their projects.
Understanding Debugging: The Foundation of Software Development
Debugging is an essential process in software development, and it often involves using debuggers examples to identify and resolve errors or bugs within applications. This practice is not merely a technical requirement; it is crucial for ensuring both functionality and reliability of programming. Research shows that almost 50% of a software project’s budget is frequently designated for rectifying errors after implementation, highlighting the essential requirement for effective error correction strategies.
By systematically analyzing software, developers can uncover issues, comprehend their underlying causes, and implement effective solutions. This foundational skill significantly enhances software quality and user satisfaction, as a well-debugged application leads to a smoother user experience, which can be demonstrated through various debuggers examples.
Enter Kodezi CLI, the autonomous solution designed specifically for B2B engineering teams. It not only enhances code quality but also resolves issues before they reach production, dramatically improving troubleshooting efficiency.
User testimonials from over 1,000,000 programmers confirm Kodezi's abilities; many have remarked on how it has changed their error correction processes, enabling them to identify and resolve problems quicker and with greater ease than manual techniques. For instance, one user remarked that Kodezi feels like unlocking a new superpower in troubleshooting, facilitating a more productive workflow and enabling developers to focus on higher-level tasks.
As noted by Ami Sterling, Director of Marketing at QualiTest:
These results reveal that a poorly designed or glitchy app interface can significantly affect user experience, resulting in frustration and potential app abandonment.
Such insights strengthen the notion that effective error correction, especially with debuggers examples like Kodezi, not only simplifies the development process but also minimizes future troubleshooting time, promoting a more productive development atmosphere. Furthermore, error correction is not only vital for project success, but also signifies a fulfilling career path in software testing.
Professionals in this field benefit from numerous opportunities and can make significant impacts on software quality and user experience. Notable quotes in software testing, such as those from Burt Rutan—'Testing leads to failure, and failure leads to understanding'—and John Ruskin—'Quality is never an accident; it is always the result of intelligent effort'—serve as motivational insights for software testers. These viewpoints highlight the significance of error-checking methods in attaining high-quality software and ensuring user satisfaction.
As the sector keeps progressing, staying informed about the latest improvements in troubleshooting resources and methods, including Kodezi and KodeziChat, is crucial for software engineers seeking to boost their efficiency and effectiveness.
To begin with Kodezi, users can utilize the '5-minute quickstart' guide and view a demo to experience its features firsthand.
Exploring Different Types of Debugging Tools
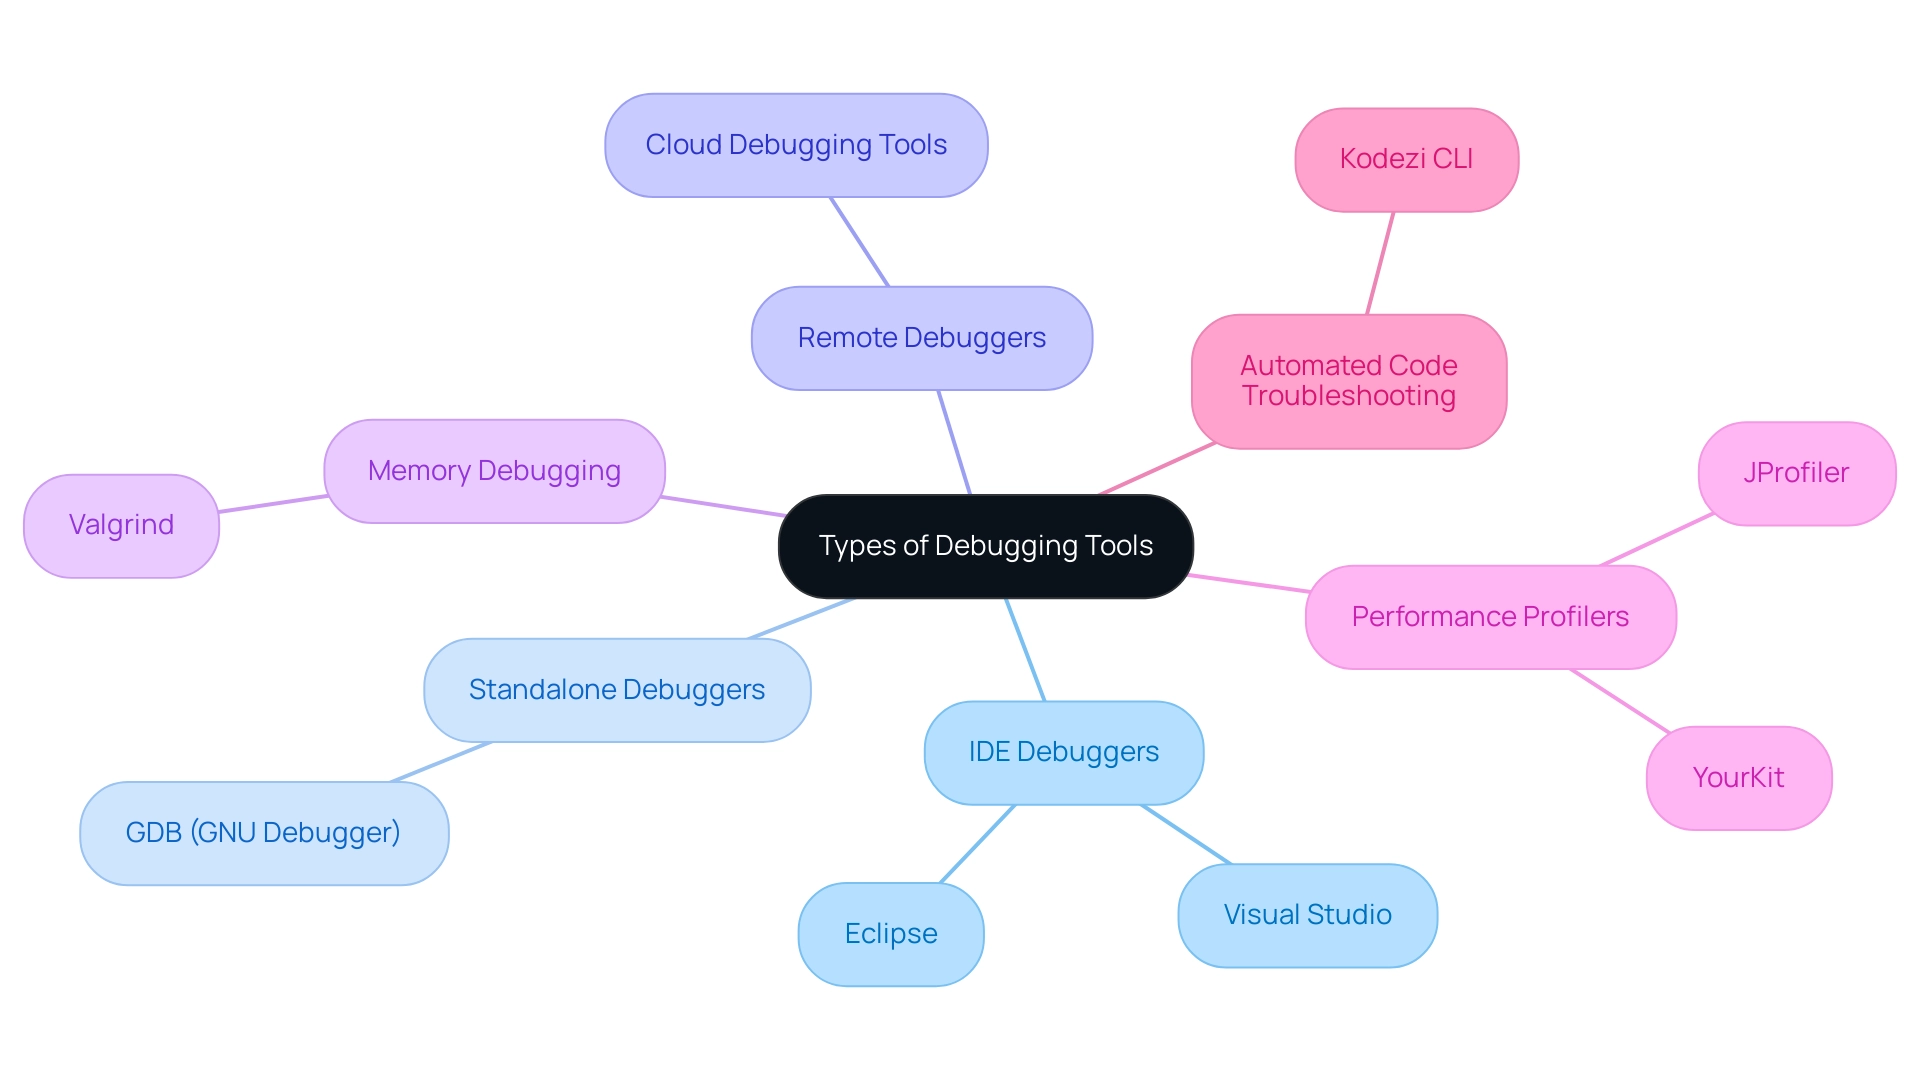
Troubleshooting tools, such as debuggers examples, are vital for programmers and are classified into various specific categories, each serving unique functions in the troubleshooting process. Understanding these categories can significantly enhance productivity and efficiency by utilizing debuggers examples. Here are the main types:
- Examples of debuggers include Integrated Development Environment (IDE) Debuggers, which are embedded within popular IDEs like Visual Studio and Eclipse, enabling programmers to set breakpoints, step through code, and inspect variables in real-time, leading to quicker issue resolution.
- Examples of standalone debuggers include tools such as GDB (GNU Debugger), which provide command-line interfaces for analyzing applications independently of an IDE. This flexibility is crucial for programmers needing a lightweight option.
- Examples of remote debuggers are essential instruments for troubleshooting applications operating on distant servers, especially in cloud settings, ensuring that programmers can uphold performance and reliability across distributed systems.
- Memory Debugging: Tools such as Valgrind are prime debuggers examples that are instrumental in identifying memory leaks and memory-related errors, thus enhancing program reliability and reducing resource consumption.
- Performance profilers, which include debuggers examples like JProfiler and YourKit, concentrate on code performance, assisting programmers in identifying bottlenecks and enhancing execution times.
Alongside these resources, automated code troubleshooting features, such as those provided by Kodezi CLI, further simplify the process by enabling programmers to auto-heal codebases in seconds, thus removing the delays linked with traditional pull requests. Kodezi CLI not only provides detailed explanations and insights into what went wrong and how issues were resolved but also enhances programming productivity by ensuring adherence to security best practices and coding standards. As the Debugging Software Market keeps expanding, hitting an estimated USD 1,750.97 Million by 2030, programmers must utilize these innovative resources and methods to enhance their debugging efficiency.

Top 10 Debuggers You Should Know About
Here are ten essential debuggers that every programmer should be familiar with:
-
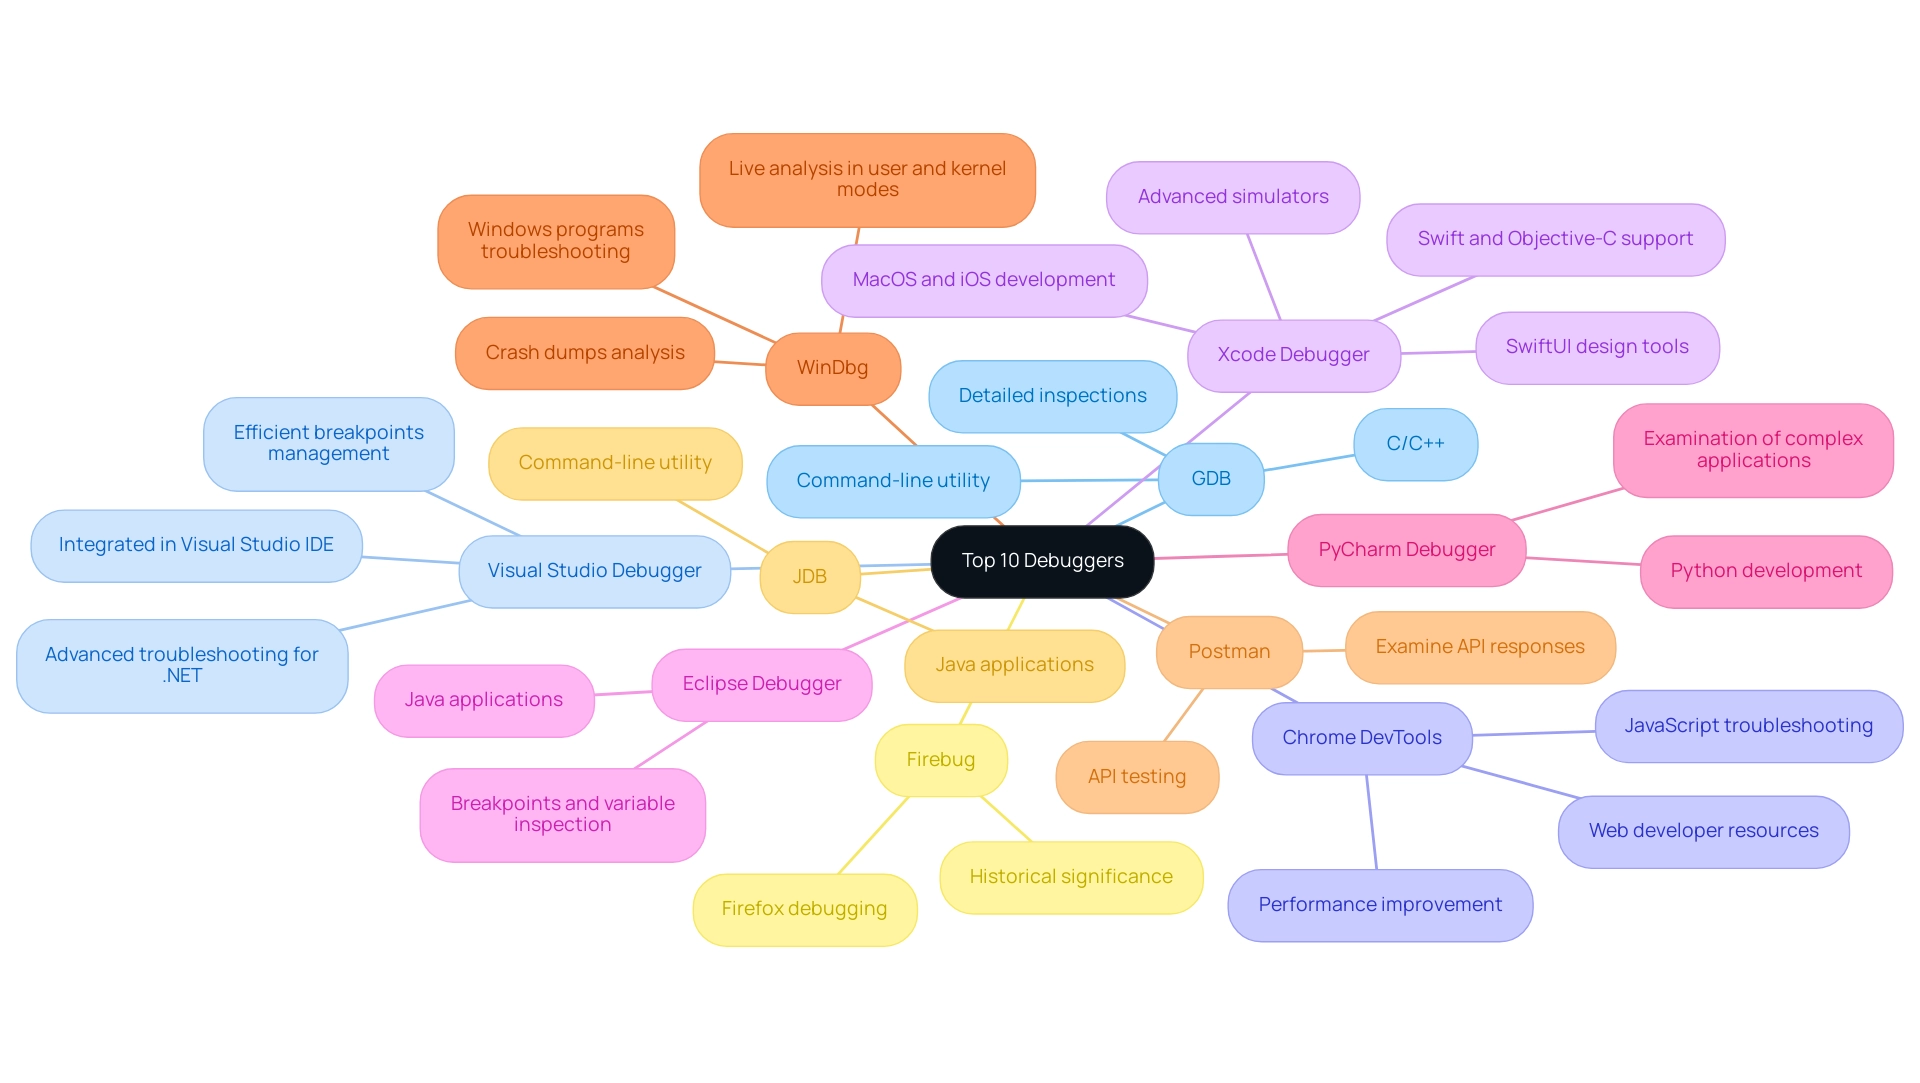
GDB, which is one of the notable debuggers examples, is a powerful command-line utility for C/C++ that allows programmers to conduct detailed inspections of program execution, rendering it essential for diagnosing complex code problems.
- Debuggers examples like the Visual Studio Debugger are integrated within the Visual Studio IDE, providing advanced troubleshooting capabilities tailored for .NET applications, allowing for efficient breakpoints management and variable tracking to speed up the troubleshooting process.
- Chrome DevTools: A collection of web developer resources integrated into Chrome, which serves as one of the best debuggers examples for troubleshooting JavaScript and improving web applications, boosting performance and user experience.
-
Examples of debuggers, such as the Xcode Debugger, are essential for developing applications on MacOS and iOS, offering robust troubleshooting features for Swift and Objective-C, including advanced simulators and SwiftUI design tools that accelerate development cycles and improve productivity.
-
Examples of debuggers, such as the Eclipse Debugger, provide a versatile tool for Java applications, offering features like breakpoints and variable inspection, which streamline the troubleshooting process and improve code quality.
- Examples of debuggers, such as the PyCharm Debugger, are specifically created for Python development, facilitating the examination of complex applications with ease and making it a favorite among Python developers seeking efficiency.
- WinDbg is a Microsoft application that is among the debuggers examples used for troubleshooting Windows programs, particularly beneficial for examining crash dumps and assisting live analysis in both user and kernel modes. This capability provides deep insights into application failures, improving the troubleshooting process.
- Postman: While mainly an API testing application, it encompasses troubleshooting features that enable programmers to examine API responses, ensuring that integrations function smoothly and effectively.
- JDB: The Java Debugger is a command-line utility and one of the notable debuggers examples created for troubleshooting Java applications, offering essential features that every Java programmer should master to improve their productivity. Although discontinued, Firebug served as a historically significant resource for Firefox, offering debuggers examples that assisted developers in troubleshooting web pages effectively.
Additionally, a case study from Sauce Labs illustrates how intelligent troubleshooting solutions can accelerate root cause analysis and prioritize impactful issues for resolution throughout the software development lifecycle. As mentioned by TrustInSoft, the professionals can also aid clients in training, support, and supplementary services associated with these troubleshooting resources.
Acquainting yourself with these resources can greatly improve your troubleshooting efficiency, resulting in quicker resolutions and enhanced software quality.

Advanced Debugging Techniques and Strategies
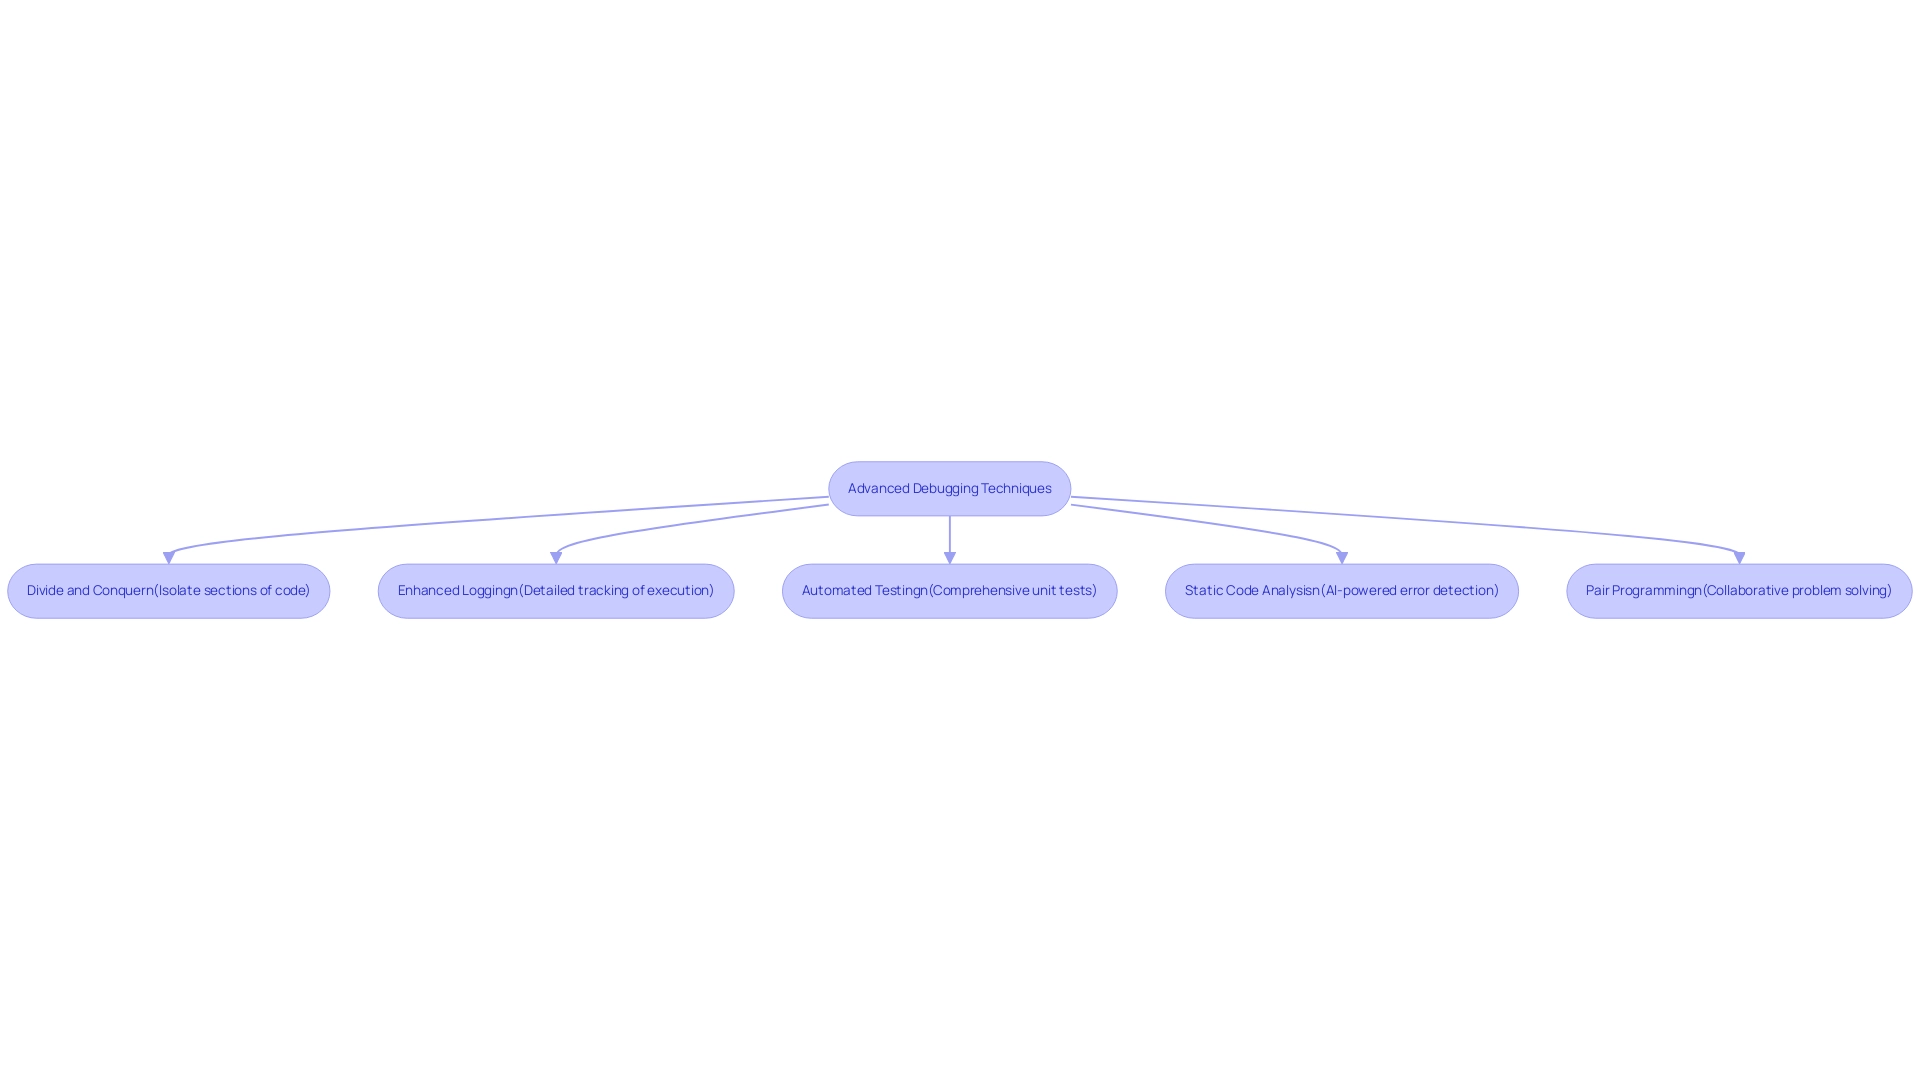
Advanced debugging techniques and tools like Kodezi are important debuggers examples that can dramatically enhance the efficiency of the debugging process. Kodezi's unique selling point is its focus on acting as an autocorrect for programming, unlike Copilot, which primarily offers autocomplete features. Here are several strategies to optimize your approach:
- Divide and Conquer: This method involves isolating sections of code to identify the source of a bug more efficiently. By breaking down the problem, developers can focus on smaller, manageable pieces, which often leads to quicker resolutions.
- Enhanced Logging: Implementing detailed logging is crucial for tracking the flow of execution and variable states. This practice not only simplifies pinpointing issues but also provides valuable insights into the program's behavior during execution. Data indicates that effective logging can enhance troubleshooting efficiency significantly, as evidenced by lines executed only in passing runs being visually represented in green with a color specification of
hsl(120.0, 50.0%, 80%). - Automated Testing: Developing comprehensive unit tests is vital for catching bugs early in the development process. Kodezi aids in this by providing automated bug analysis and correction, ensuring that potential issues are identified before they escalate, ultimately leading to a more efficient workflow. This is particularly beneficial for programmers across all industries, whether they are beginners or professionals seeking optimization.
- Static Code Analysis: Utilizing Kodezi's AI-powered tools to analyze programs without executing them helps in identifying potential errors and vulnerabilities proactively. Kodezi can optimize code and even produce comments, saving significant time and resources in the error correction phase.
- Pair Programming: Collaborating with another developer through pair programming can provide fresh perspectives on complex problems. This technique often leads to quicker resolutions, as two minds can analyze the issue from different angles.
In addition, the effectiveness of advanced troubleshooting techniques is supported by research, with Abreu et al. stating, "The Tarantula metric was among the first such metrics, and the Ochiai metric is generally shown to be among the most effective ones." Furthermore, the case study on Middle Function Analysis demonstrates that the Ochiai Metric can be effectively used across different functions to assess and rank suspiciousness in error detection, showcasing its practical application.
By employing these advanced strategies and utilizing resources such as Kodezi for automated code troubleshooting, performance enhancement, and security compliance, developers can simplify their troubleshooting processes using debuggers examples and attain superior results, making their software development efforts more efficient and productive.

Integrating Debugging into Your Development Workflow
Incorporating error detection into your development workflow is not only advantageous; it’s essential for maximizing efficiency. With tools like Kodezi CLI, which autonomously improves your codebase and fixes bugs before they reach production, teams can significantly enhance their debugging processes with various debuggers examples. Here are some best practices that can further optimize your workflow:
- Regular Reviews: Conducting frequent reviews is imperative for early identification of potential issues and fostering a culture of quality. Statistics indicate that 95% of modifications following review processes are accurate the first time, underscoring the effectiveness of this practice.
- Continuous Integration: Implement CI/CD pipelines that incorporate automated testing. By integrating Kodezi CLI into these pipelines, you can catch bugs before they reach deployment, ensuring that the software remains robust and reliable. As Henrique Madeira, co-founder of Critical Software, S.A., states, "Continuous integration is key to successful troubleshooting," highlighting its role in maintaining code quality.
- Documentation: Clear documentation of known issues and resolutions is essential. This practice streamlines future troubleshooting efforts and serves as a valuable resource for the team.
- Set Troubleshooting Standards: Establishing team-wide standards for troubleshooting practices ensures consistency and effectiveness across the development cycle. Notably, a case study by Alexey Shcheglov highlights the importance of coding standards to overcome review challenges, providing practical strategies such as adopting uniform coding conventions and minimizing task interruptions to enhance review efficiency.
- Allocate Time for Troubleshooting: Dedicating specific time slots in the development cycle for troubleshooting ensures that it receives the attention it deserves. Matthew Wolfe, a user on Hacker News, observes that smaller pull requests lead to more thorough reviews and better feedback. This practice not only enhances the quality of programming but also permits concentrated troubleshooting time, which is vital for addressing problems efficiently.
By embedding these debuggers examples and debugging practices into your workflow and leveraging Kodezi CLI, you not only enhance code quality but also significantly improve overall team productivity. For those interested in getting started, check out the '5-minute quick start guide' and see a demo to explore Kodezi CLI's capabilities in action.
Conclusion
Debugging is an indispensable element of software development that directly influences the quality and reliability of applications. As demonstrated throughout the article, effective debugging strategies not only mitigate costly errors but also enhance the overall user experience. Tools like Kodezi CLI stand out by automating the debugging process, allowing developers to focus on more strategic tasks rather than getting bogged down by manual error resolution.
The exploration of various debugging tools and techniques highlights the importance of integrating advanced strategies into development workflows. From utilizing IDE debuggers to adopting automated testing and enhanced logging, developers can significantly streamline their debugging efforts. Furthermore, leveraging Kodezi’s capabilities empowers teams to identify and rectify issues swiftly, ultimately fostering an environment of increased productivity and collaboration.
In conclusion, embracing innovative debugging solutions is essential for any engineering team aiming to elevate their software quality and efficiency. By prioritizing debugging in the development process and utilizing tools like Kodezi, teams can ensure that they not only meet but exceed user expectations, paving the way for successful project outcomes and a more robust software ecosystem.
Frequently Asked Questions
What is the importance of debugging in software development?
Debugging is crucial for identifying and resolving errors or bugs within applications, ensuring both functionality and reliability. It is a significant part of the software development process that enhances software quality and user satisfaction.
How much of a software project’s budget is typically allocated for error correction?
Research indicates that almost 50% of a software project’s budget is often designated for rectifying errors after implementation.
What is Kodezi CLI and how does it help in debugging?
Kodezi CLI is an autonomous solution designed for B2B engineering teams that enhances code quality and resolves issues before they reach production, improving troubleshooting efficiency.
What do user testimonials say about Kodezi?
User testimonials from over 1,000,000 programmers highlight that Kodezi significantly improves their error correction processes, allowing them to identify and resolve problems more quickly and easily than with manual techniques.
What are some consequences of a poorly designed app interface?
A poorly designed or glitchy app interface can lead to a significantly negative user experience, resulting in frustration and potential abandonment of the app.
What are the main types of debugging tools?
The main types of debugging tools include: 1. IDE Debuggers: Embedded within popular IDEs like Visual Studio and Eclipse. 2. Standalone Debuggers: Tools like GDB that offer command-line interfaces for independent analysis. 3. Remote Debuggers: Essential for troubleshooting applications on distant servers, especially in cloud environments. 4. Memory Debugging Tools: Such as Valgrind, which help identify memory leaks and related errors. 5. Performance Profilers: Tools like JProfiler and YourKit that focus on code performance and identifying bottlenecks.
How does Kodezi CLI enhance debugging efficiency?
Kodezi CLI simplifies the debugging process by enabling auto-healing of codebases in seconds, providing detailed explanations of issues, and ensuring adherence to security best practices and coding standards.
What is the projected growth of the debugging software market?
The debugging software market is expected to expand to an estimated USD 1,750.97 million by 2030.
How can users get started with Kodezi?
Users can begin with Kodezi by utilizing the '5-minute quickstart' guide and viewing a demo to experience its features firsthand.


