Introduction
In the dynamic realm of mobile application development, debugging plays a pivotal role in ensuring that apps perform flawlessly across a myriad of devices. As the demand for seamless user experiences intensifies, engineering teams are turning to innovative solutions like Kodezi CLI to streamline their debugging processes. This powerful tool not only automates the identification and resolution of bugs but also enhances code quality, allowing developers to focus on what truly matters: delivering exceptional applications.
From understanding mobile architecture to leveraging advanced debugging methods, this article delves into the essential strategies and tools that empower teams to tackle common challenges, optimize performance, and ultimately elevate user satisfaction in an increasingly competitive landscape.
Understanding Mobile Application Debugging
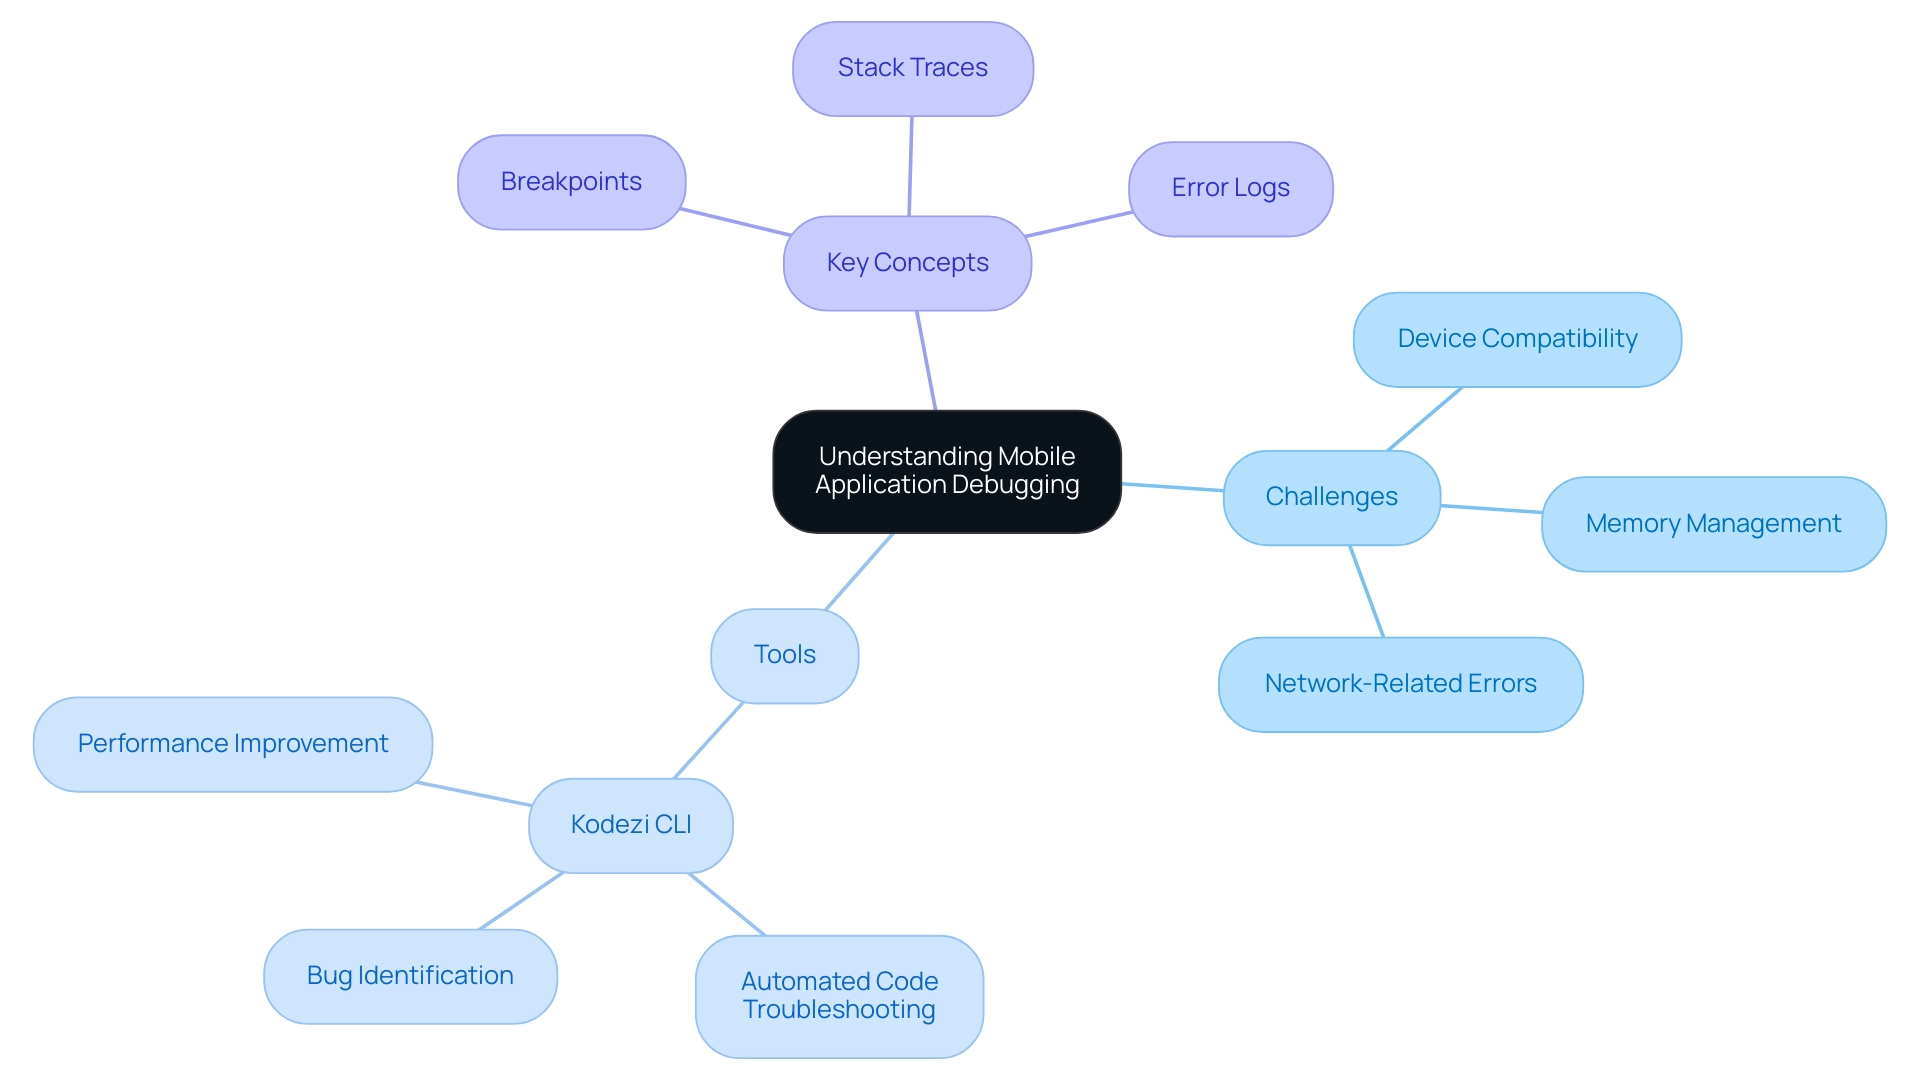
Troubleshooting mobile apps often involves debugging mobile chrome, which is an essential process that emphasizes recognizing and addressing problems affecting the performance and functionality of applications across different platforms. With Kodezi CLI, engineering teams can autonomously enhance their code quality and quickly fix bugs before they reach production, ensuring a seamless user experience in today's competitive landscape. Comprehending mobile architecture constitutes the backbone of effective problem-solving, enabling developers to identify where issues may occur.
Common challenges include:
- Device compatibility
- Memory management
- Network-related errors
These challenges can be swiftly resolved through debugging mobile chrome using Kodezi's automated code troubleshooting features. Kodezi CLI not only identifies these issues but also provides detailed explanations and insights into what went wrong and how it was resolved. Familiarity with key concepts such as breakpoints, stack traces, and error logs is essential for debugging mobile chrome, as these tools empower developers to efficiently diagnose problems.
As Docker notes, 'investing in such tools and implementing more effective practices can help streamline these processes, reduce time spent on issues, and result in smoother, more productive development cycles.' Additionally, prioritizing tasks during urgent acquisition deadlines, much like the contributions made towards fundraising goals, is crucial for effective problem-solving. The case study titled 'Aligning Team on Data Insights' illustrates how teams can overcome challenges in portable troubleshooting by fostering shared objectives and open discussions.
By adopting Kodezi CLI, teams not only mitigate risks but also improve overall app performance, paving the way for a more reliable user experience. To get started, teams can utilize the 5-minute quickstart and see a demo, showcasing how Kodezi CLI can transform their troubleshooting processes.

Preparing for Debugging: Essential Files and Setup
To enhance efficiency in application troubleshooting, begin by ensuring access to essential files, such as the source code, configuration files, and relevant documentation. Setting up your development environment is crucial for debugging mobile chrome; install the latest version of Chrome and activate Developer Options on your mobile device. A reliable USB connection or a dependable network for remote troubleshooting is also vital.
This groundwork not only streamlines the troubleshooting process but significantly reduces potential roadblocks, allowing for a more productive troubleshooting experience. As developers highlight, possessing the correct files and configuration can significantly affect troubleshooting efficiency, ultimately resulting in quicker solutions and improved software performance. Furthermore, utilizing tools like Kodezi can autonomously analyze code, correct issues, and optimize your codebase before it reaches production, thus enhancing overall productivity.
Kodezi's ability to automatically identify and fix bugs, as well as generate comments, sets it apart from traditional tools like Copilot, which focus on autocomplete rather than autocorrect functionalities. Mobile app security must be the focus of the entire software development lifecycle, not an afterthought. Taking into account that 51% of users find new businesses or products while browsing on their handheld gadgets highlights the significance of effective troubleshooting in improving user involvement and discovery.
Furthermore, incorporating solutions such as App Protector can enhance application security and assist in debugging mobile chrome efficiency.
Launching Chrome for Mobile Debugging
To successfully initiate Chrome for smartphone troubleshooting in 2024, start by linking your phone to your computer with a USB cable. Open Chrome on your desktop and enter chrome://inspect in the address bar. Ensure that your handheld gadget is recognized; if not, check your connections and configurations.
Next, enable USB troubleshooting on your gadget by navigating to Developer Options and toggling the USB troubleshooting feature to 'on', which is essential for debugging mobile chrome and ensures smooth communication between your handheld gadget and the desktop environment. Once USB troubleshooting is enabled, you should see your gadget listed under the Remote Target section of Chrome. Click 'Inspect' next to your gadget to open Chrome DevTools, which is essential for debugging mobile chrome and starting the analysis of your application.
With portable devices representing over 63% of global web traffic and having represented 54.01% of webpage views in Q1 '18, utilizing these troubleshooting techniques is crucial for enhancing user experiences across platforms. As IG Rosales, Head of Content at Genius, emphasizes, 'A relentless quest for the perfect coffee' parallels the pursuit of perfecting user experiences through effective troubleshooting. Furthermore, considering the diverse application of web standards by various browsers, as emphasized in the case study on cross-browser testing, ensuring compatibility is essential in smartphone troubleshooting to attain a consistent user experience.
Exploring Debugging Methods: USB and Remote Debugging
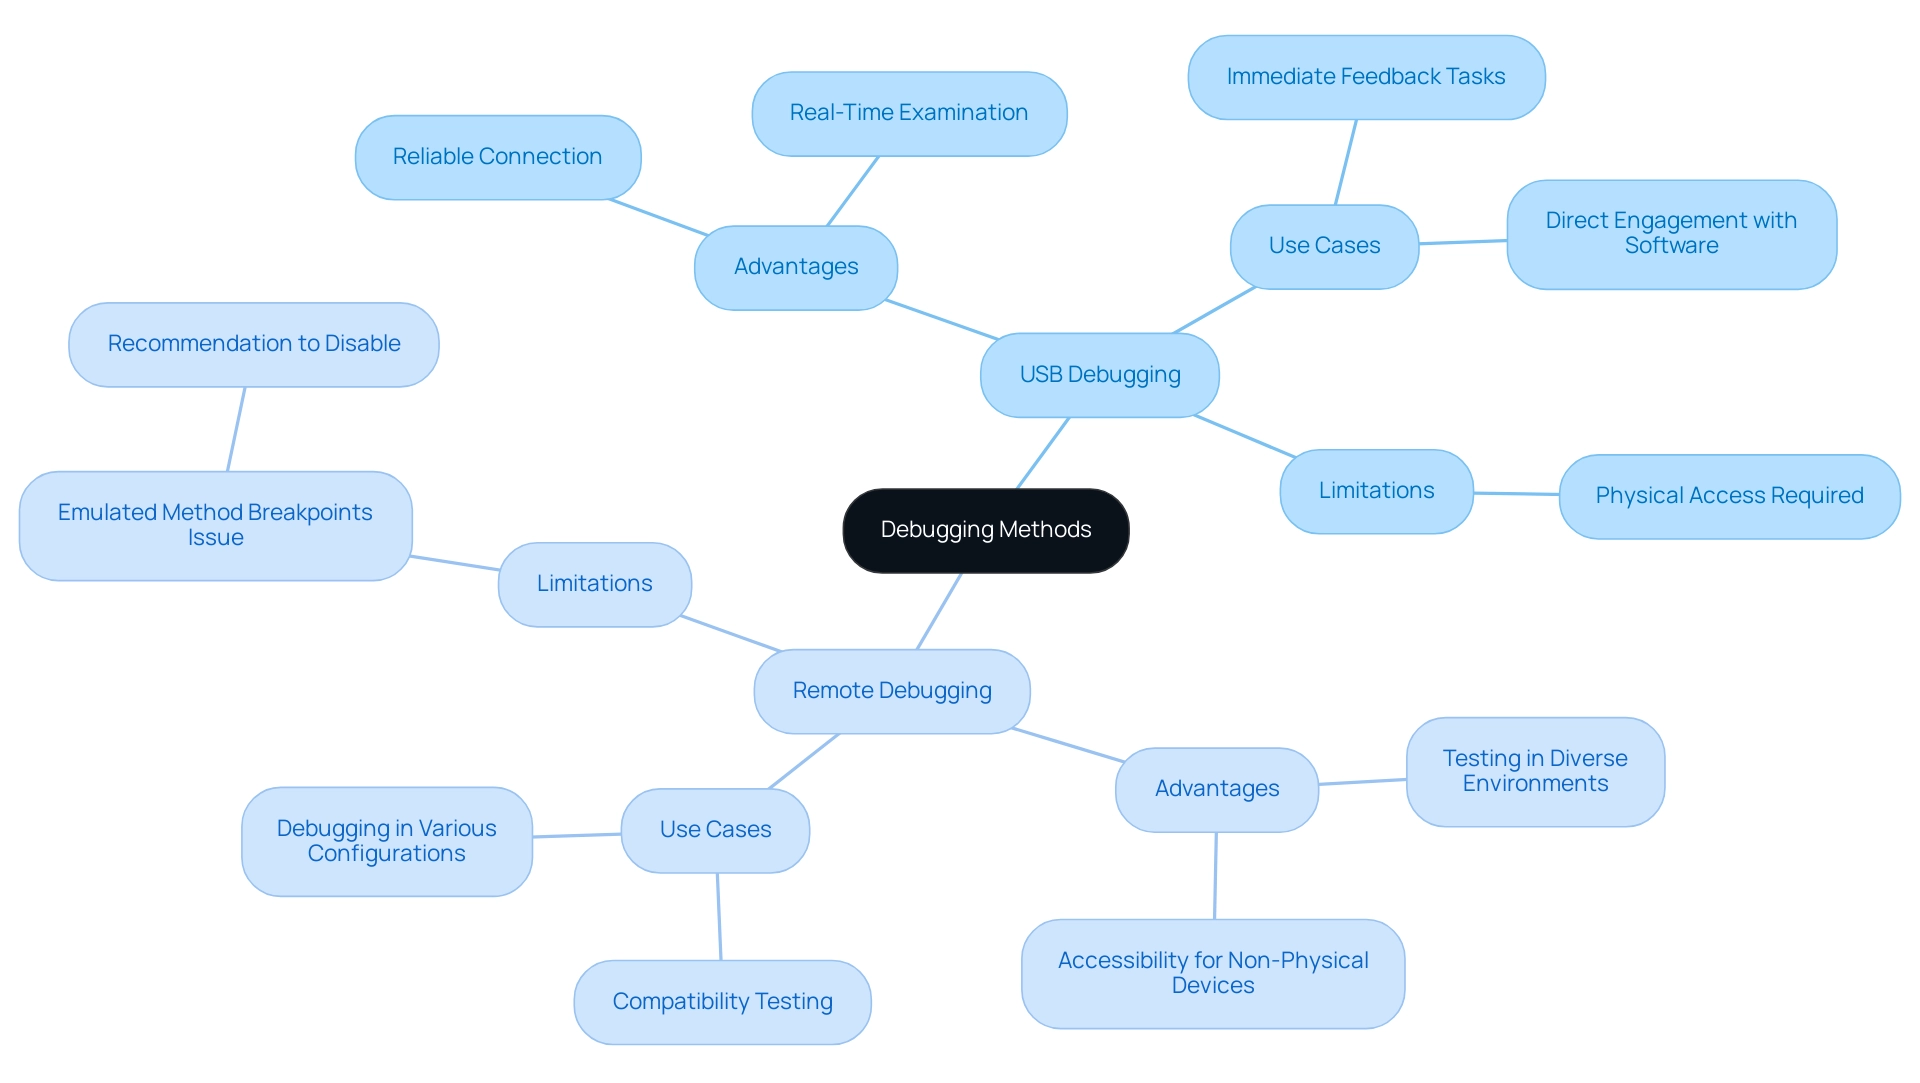
When it involves troubleshooting portable software, debugging mobile chrome and remote troubleshooting are two main techniques that stand out. USB troubleshooting is essential for debugging mobile chrome, providing developers a direct link to their mobile gadget, enabling real-time examination and direct engagement with software. This stable connection is particularly advantageous for tasks that require immediate feedback, making it a preferred choice for many developers.
In comparison, distant troubleshooting excels in situations where equipment is not physically reachable, such as during debugging mobile chrome, providing the ability to test applications in different environments. This method is increasingly vital as developers seek to ensure compatibility with diverse devices and configurations. However, as Gedalyah Reback, Senior Product Marketing Manager, notes, "a major drawback to using IntelliJ in this situation is the recommendation to disable emulated method breakpoints during debugging mobile chrome," which could impact the troubleshooting process.
Each technique offers distinct advantages; USB troubleshooting is defined by its reliability, while debugging mobile chrome enhances testing capabilities in diverse contexts. Additionally, it is important to note that Android 4.1 introduced limited support for audio playback in accessory mode, which requires a 16-bit PCM format, 44.1 kHz sample rate, and 2-channel stereo. Understanding when to leverage each method can significantly streamline the development process, ultimately boosting efficiency and productivity.
Moreover, practical uses of these troubleshooting techniques can be observed in case studies like iClicker, which promotes student involvement through technology, demonstrating how effective problem-solving can result in improved user experiences.

Leveraging Chrome DevTools for Effective Debugging
Chrome DevTools provides a robust set of features essential for effective debugging mobile chrome, especially in situations where performance is crucial. For instance, the dissatisfied customer profile mimics a sluggish, restricted connection (slow 3G) using 10 popular browser extensions, highlighting the importance of performance enhancement in mobile software. By utilizing the Elements panel, developers can inspect the DOM and execute real-time modifications to HTML and CSS for instant visual feedback.
The Console panel is vital for monitoring error messages and logging output, allowing quick identification of issues that could hinder performance. Additionally, the Network panel provides detailed insights into data flow by analyzing network requests and responses, while the Sources panel enables developers to set breakpoints and systematically step through code. Enabling the Memory checkbox reveals memory metrics that assist in diagnosing performance bottlenecks.
Moreover, activating the 'CSS Overview' feature in Chrome's experimental settings generates a comprehensive report on CSS declarations, colors, fonts, media queries, and unused declarations, empowering developers to enhance their stylesheets for better performance. Significantly, Chrome DevTools also assists in identifying security issues by offering tools to audit the security of web platforms and ensure adherence to best practices. Exception handling can be enhanced through the troubleshooting process, allowing developers to catch and manage errors effectively.
A practical demonstration of these tools in action can be seen in the case study titled 'Find Scroll Performance Issues in Real Time,' which highlights how to identify scrolling performance issues by pinpointing problematic elements. Armed with these tools, developers can significantly improve their debugging efficiency, especially when it comes to debugging mobile chrome, leading to swift issue resolution, optimized mobile applications, and enhanced security compliance.
Conclusion
The journey through mobile application debugging reveals the essential role it plays in delivering high-quality user experiences. By leveraging innovative tools like Kodezi CLI, engineering teams can automate the identification and resolution of bugs, ensuring that applications perform optimally across diverse devices. Understanding mobile architecture and the common challenges developers face, such as device compatibility and network-related errors, equips teams to tackle issues head-on, ultimately enhancing app performance.
Setting the stage for effective debugging involves meticulous preparation, including access to essential files and a well-configured development environment. This groundwork is crucial for maximizing efficiency and minimizing potential roadblocks. With Kodezi's capabilities to autonomously analyze and correct code, developers can streamline their workflows and focus on creating exceptional applications.
Utilizing methods like USB and remote debugging allows for flexibility and reliability in testing applications, ensuring compatibility across various environments. Coupled with powerful tools such as Chrome DevTools, developers can gain real-time insights into their applications, enabling them to optimize performance and identify security vulnerabilities swiftly.
In a landscape where user satisfaction drives success, adopting these advanced debugging strategies significantly enhances productivity and application reliability. By prioritizing effective debugging processes, teams not only mitigate risks but also pave the way for superior user experiences—an essential factor in today's competitive mobile app market. Embracing these practices can lead to transformative outcomes, fostering both innovation and excellence in mobile application development.
Frequently Asked Questions
What is the importance of debugging mobile apps?
Debugging mobile apps is essential for recognizing and addressing problems that affect the performance and functionality of applications across different platforms, ensuring a seamless user experience.
What is Kodezi CLI and how does it assist in debugging?
Kodezi CLI is a tool that allows engineering teams to autonomously enhance code quality and quickly fix bugs before they reach production, thereby improving overall app performance and reliability.
What are some common challenges faced during mobile app debugging?
Common challenges include device compatibility, memory management, and network-related errors.
How can Kodezi CLI help resolve debugging challenges?
Kodezi CLI can swiftly resolve debugging challenges by identifying issues and providing detailed explanations and insights into what went wrong and how it was resolved.
What key concepts should developers be familiar with for effective debugging?
Developers should be familiar with key concepts such as breakpoints, stack traces, and error logs, as these tools help efficiently diagnose problems.
What preliminary steps should be taken to enhance troubleshooting efficiency?
Ensure access to essential files (source code, configuration files, documentation), set up the development environment with the latest version of Chrome, activate Developer Options on the mobile device, and establish a reliable USB connection or network for remote troubleshooting.
How does Kodezi enhance productivity in the troubleshooting process?
Kodezi autonomously analyzes code, corrects issues, and optimizes the codebase before it reaches production, resulting in quicker solutions and improved software performance.
How does Kodezi CLI differ from traditional tools like Copilot?
Unlike traditional tools like Copilot, which focus on autocomplete functionalities, Kodezi CLI specializes in autocorrect capabilities, automatically identifying and fixing bugs.
Why is mobile app security important in the troubleshooting process?
Mobile app security must be prioritized throughout the software development lifecycle to enhance user involvement and discovery, as a significant percentage of users find new businesses or products while browsing on mobile devices.
What additional solutions can improve debugging efficiency?
Solutions like App Protector can enhance application security and assist in improving debugging efficiency for mobile apps.


