Introduction
In the realm of software development, memory management stands as a fundamental pillar that directly influences application performance and stability. Memory leaks, a prevalent yet often overlooked issue, can lead to significant inefficiencies, causing applications to consume excessive resources and ultimately crash. Understanding the nuances of memory leaks is crucial for developers aiming to create robust and high-performing applications.
By recognizing the telltale signs of memory misuse and employing effective strategies for detection and prevention, developers can not only enhance their coding practices but also ensure a seamless user experience.
This article delves into the intricacies of memory leaks, offering a comprehensive guide on:
- Identifying their causes
- Utilizing essential tools
- Implementing best practices to safeguard applications against this silent threat.
Understanding Memory Leaks: What Every Developer Should Know
Resource retention issues pose a significant challenge in software development, particularly when trying to locate memory leaks, as this occurs when a program allocates space but fails to free it upon completion. This oversight can result in increased resource usage and, ultimately, system failures, particularly in long-running processes. The consequences of information retention issues extend beyond simple inefficiency; they can significantly impair software performance and security compliance.
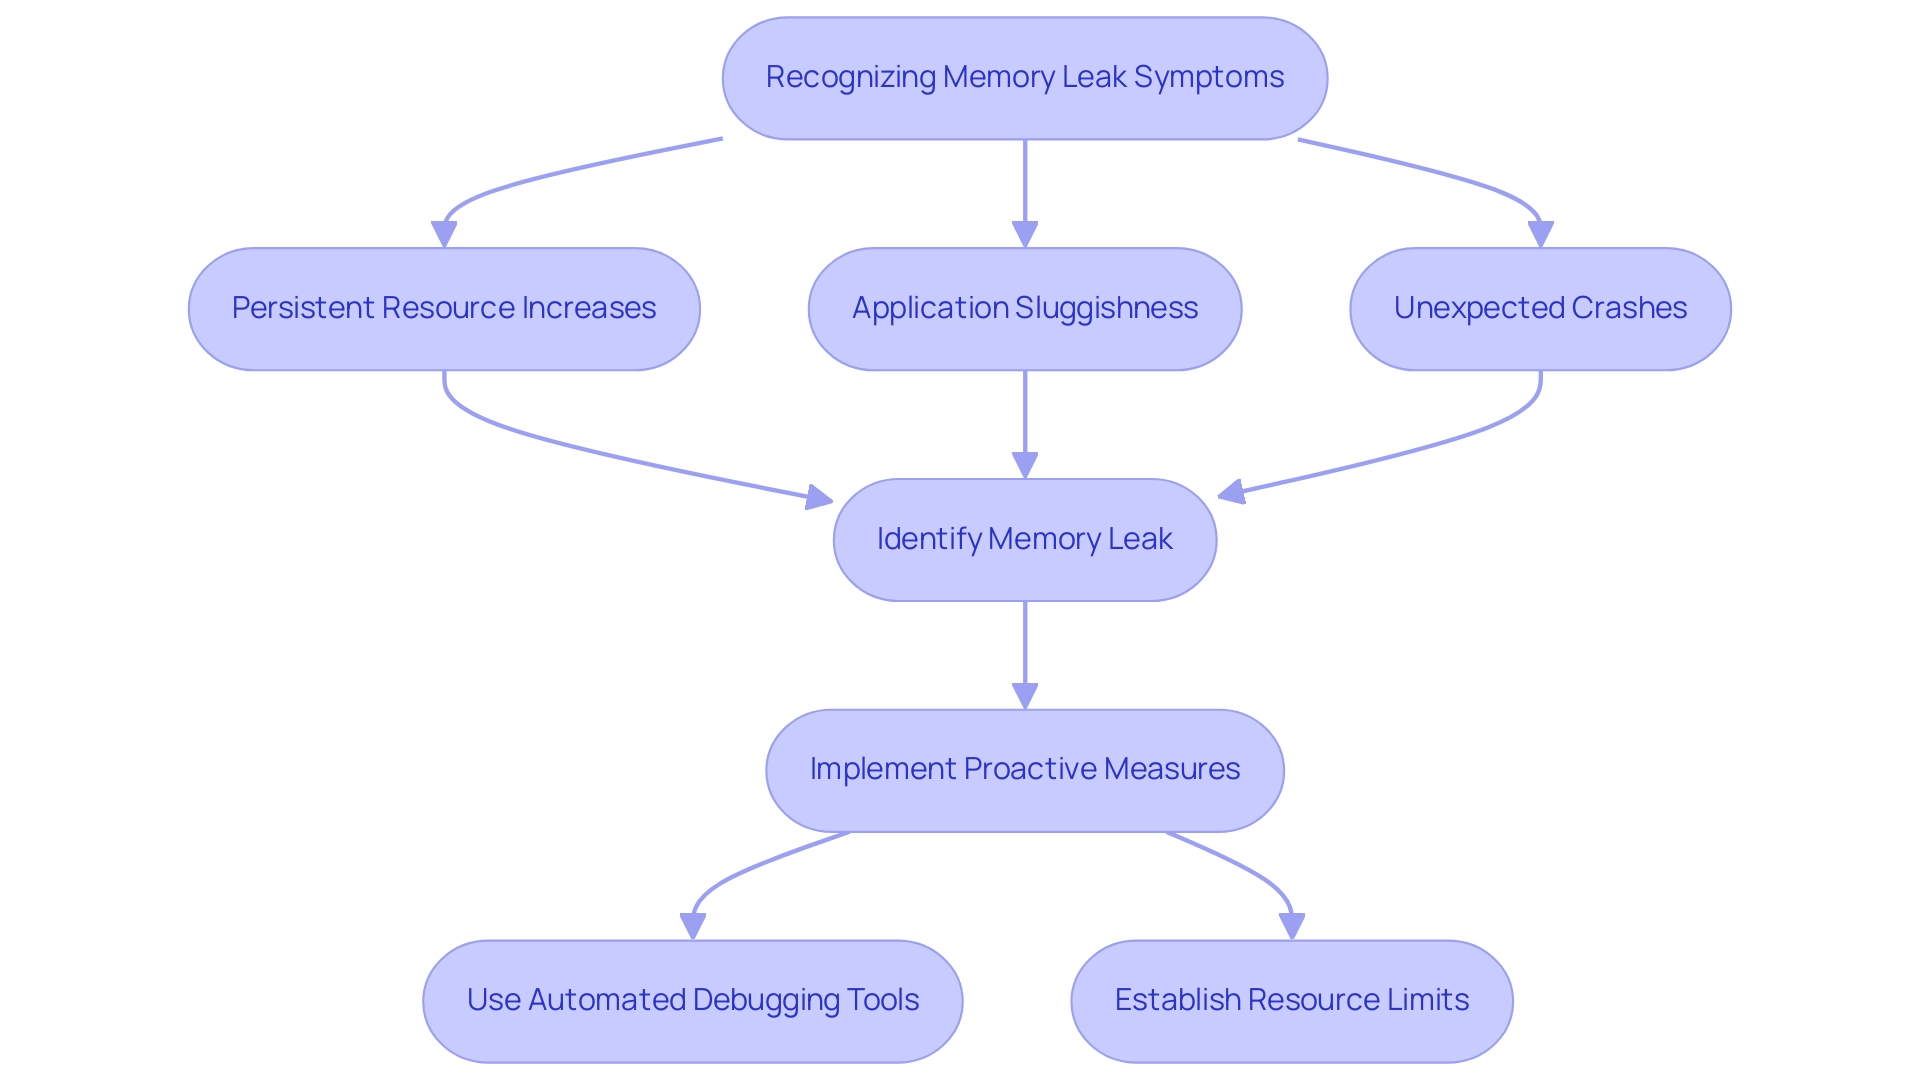
Key indicators of resource drains include:
- Persistent increases in usage over time
- Noticeable sluggishness in application responsiveness
- Unexpected crashes
Recognizing these symptoms early is paramount for developers, as it allows them to locate memory leak issues and implement proactive measures to resolve the underlying issues swiftly. As George Kampitakis aptly notes, "If you always question the suspicious parts of your code, you will certainly gain better understanding of what’s going on."
To prevent resource leaks and enhance performance, it's crucial to locate memory leaks by establishing limits on resource creation and managing references carefully. Automated code debugging resources can instantly identify and fix these issues by providing detailed explanations and insights into what went wrong, ensuring adherence to the latest security best practices and coding standards. For those looking to enhance their memory management capabilities, Datadog offers a 14-day free trial, providing a practical resource to explore.
Additionally, a case study on deferring function calls highlights that deferring a large number of functions, especially in loops, can exhaust system resources. This is where automated debugging tools come into play; they can help locate memory leak inefficiencies and suggest optimizations. To mitigate resource exhaustion, file processing should be handled in a separate function to ensure each file is closed before moving to the next, thus managing resources effectively.
By fostering a vigilant approach to code management and utilizing advanced code optimization techniques, developers can significantly enhance software stability and user experience.

Step-by-Step Guide to Locating Memory Leaks in Node.js
-
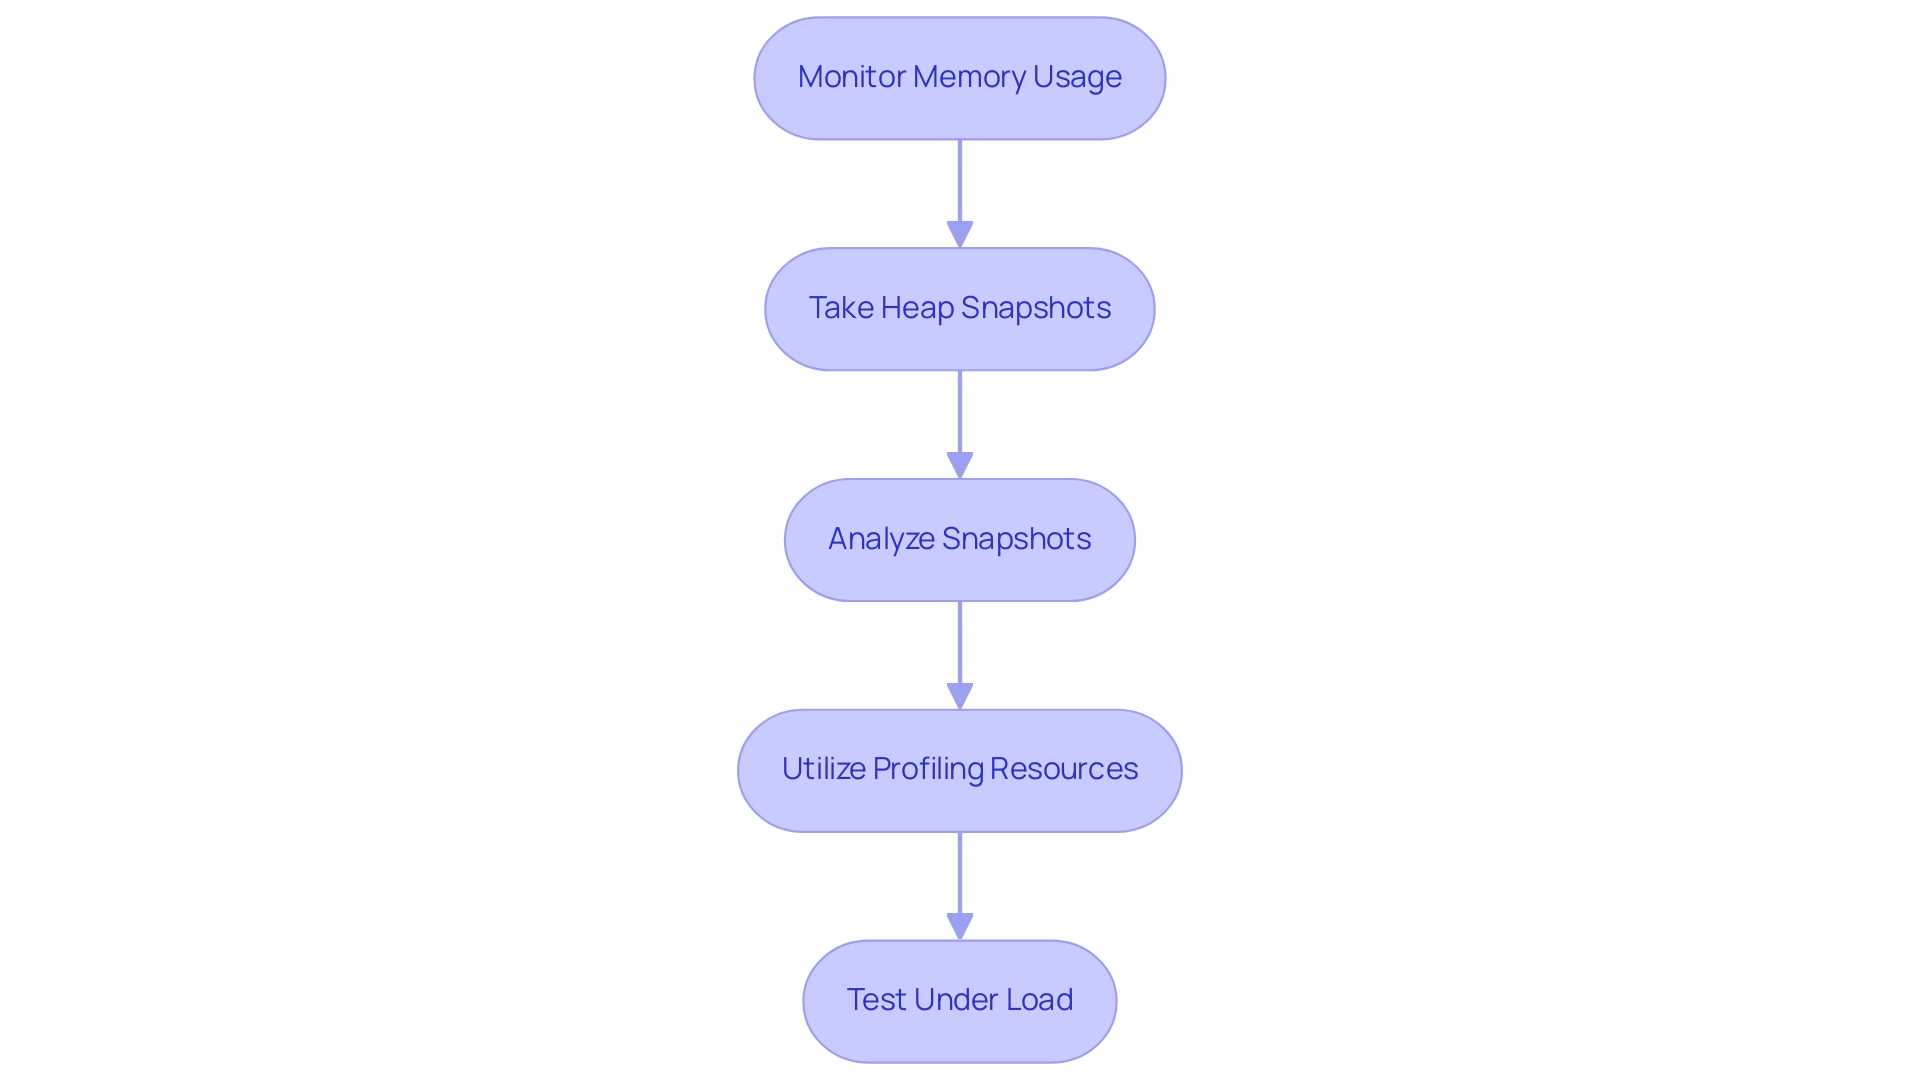
Monitor Memory Usage: Start by leveraging the built-in
process.memoryUsage()method. This enables you to record resource usage at different phases of your software, offering essential information for subsequent examination. For instance, a script may use approximately 1278.83 MB for an array of 100 million elements. Regular logging of this information can reveal trends over time, making it easier to identify anomalies. -
Take Heap Snapshots: Employ tools such as Chrome DevTools or
v8-profilerto create heap snapshots. These snapshots are invaluable for visualizing resource allocation over time, enabling you to see how usage evolves as your application runs.- Analyze Snapshots: Once you have your snapshots, the next step is to compare them. Look for objects that aren’t being garbage collected; retained objects that should have been released can indicate potential resource leaks. This analysis is crucial for pinpointing inefficiencies in resource usage. As Valentino, a freelance consultant, observes, comprehending resource allocation is key in providing effective coaching and training on JavaScript and testing.
- Utilize Profiling Resources: Integrate profiling resources like
clinic.jsor use thenode --inspectcommand to monitor memory consumption in real-time. These tools provide insights into your software's performance, helping to identify potential leaks as they occur, which is essential for maintaining optimal efficiency. - Test Under Load: Conduct tests simulating high-traffic scenarios to observe how your system handles increased demand over time. This stress testing can help reveal any significant growth related to specific actions or processes, allowing you to address issues before they affect your users. For instance, in a case study named 'Example 2: Usage in Megabytes', the output from the
process.memoryUsage()method effectively showed the consumption of different components, demonstrating the practical application of monitoring usage.

Essential Tools and Techniques for Memory Leak Detection
- Heapdump: This powerful tool enables developers to capture a snapshot of the heap storage at any moment. By examining the heap dump with Chrome DevTools, developers can effectively locate memory leaks by pinpointing retained objects that may suggest leaks in resource usage. The capacity to visualize resource usage is crucial for pinpointing inefficiencies.
- Garbage Collection Logs: Activating garbage collection logging in Node.js offers valuable insights into allocation and deallocation patterns. This thorough monitoring is crucial to locate [[[memory leak issues](https://github.com/0voice/kernel_memory_management/blob/main/✍ 文章/5 useful tools to detect memory leaks with examples.md)](https://github.com/0voice/kernel_memory_management/blob/main/✍ 文章/5 useful tools to detect memory leaks with examples.md)](https://github.com/0voice/kernel_memory_management/blob/main/✍ 文章/5 useful tools to detect memory leaks with examples.md) with stored information. By analyzing these logs, developers can locate memory leak issues and gain insights into the efficiency of garbage collection, which has shown to significantly impact overall application performance.
- Node.js Inspector: This integrated utility provides a thorough debugging setting, enabling developers to examine resource usage directly and detect issues in real-time. Its integration within the Node.js ecosystem makes it a convenient option for developers seeking immediate feedback on resource consumption.
- clinic.js: A collection of diagnostic resources specifically created for Node.js environments, clinic.js excels at detecting performance problems, including resource issues. It generates visual reports that simplify complex data, making it easier for developers to locate memory leak issues and address memory-related problems.
- Memory Profiler: This utility is crucial for monitoring resource utilization over time, enabling developers to locate [memory leak trends](https://github.com/0voice/kernel_memory_management/blob/main/✍ 文章/5 useful tools to detect memory leaks with examples.md) and spikes that may indicate issues. By consistently observing resource allocation, developers can proactively oversee assets and uphold program efficiency.
As Johan Lindh, author of MEMWATCH, emphasizes,
MEMWATCH is an open-source error-detection resource for C.
This emphasizes the significance of strong resources in data management across various programming languages. Furthermore, based on Dynatrace's findings, efficient detection resources for resource issues can greatly decrease usage, improving software performance.
Additionally, [[[[the Intel Inspector XE case](https://github.com/0voice/kernel_memory_management/blob/main/✍ 文章/5 useful tools to detect memory leaks with examples.md)](https://github.com/0voice/kernel_memory_management/blob/main/✍ 文章/5 useful tools to detect memory leaks with examples.md) study](https://github.com/0voice/kernel_memory_management/blob/main/✍ 文章/5 useful tools to detect memory leaks with examples.md)](https://github.com/0voice/kernel_memory_management/blob/main/✍ 文章/5 useful tools to detect memory leaks with examples.md) demonstrates a proprietary application that conducts static and dynamic analysis to uncover underlying reasons for resource failures, identifying problems such as corrupted data and unauthorized access. Keeping informed about new advancements in detection of resource issues, including tools arising in 2024, will further enable developers to sustain strong and effective applications.
Identifying Common Causes of Memory Leaks
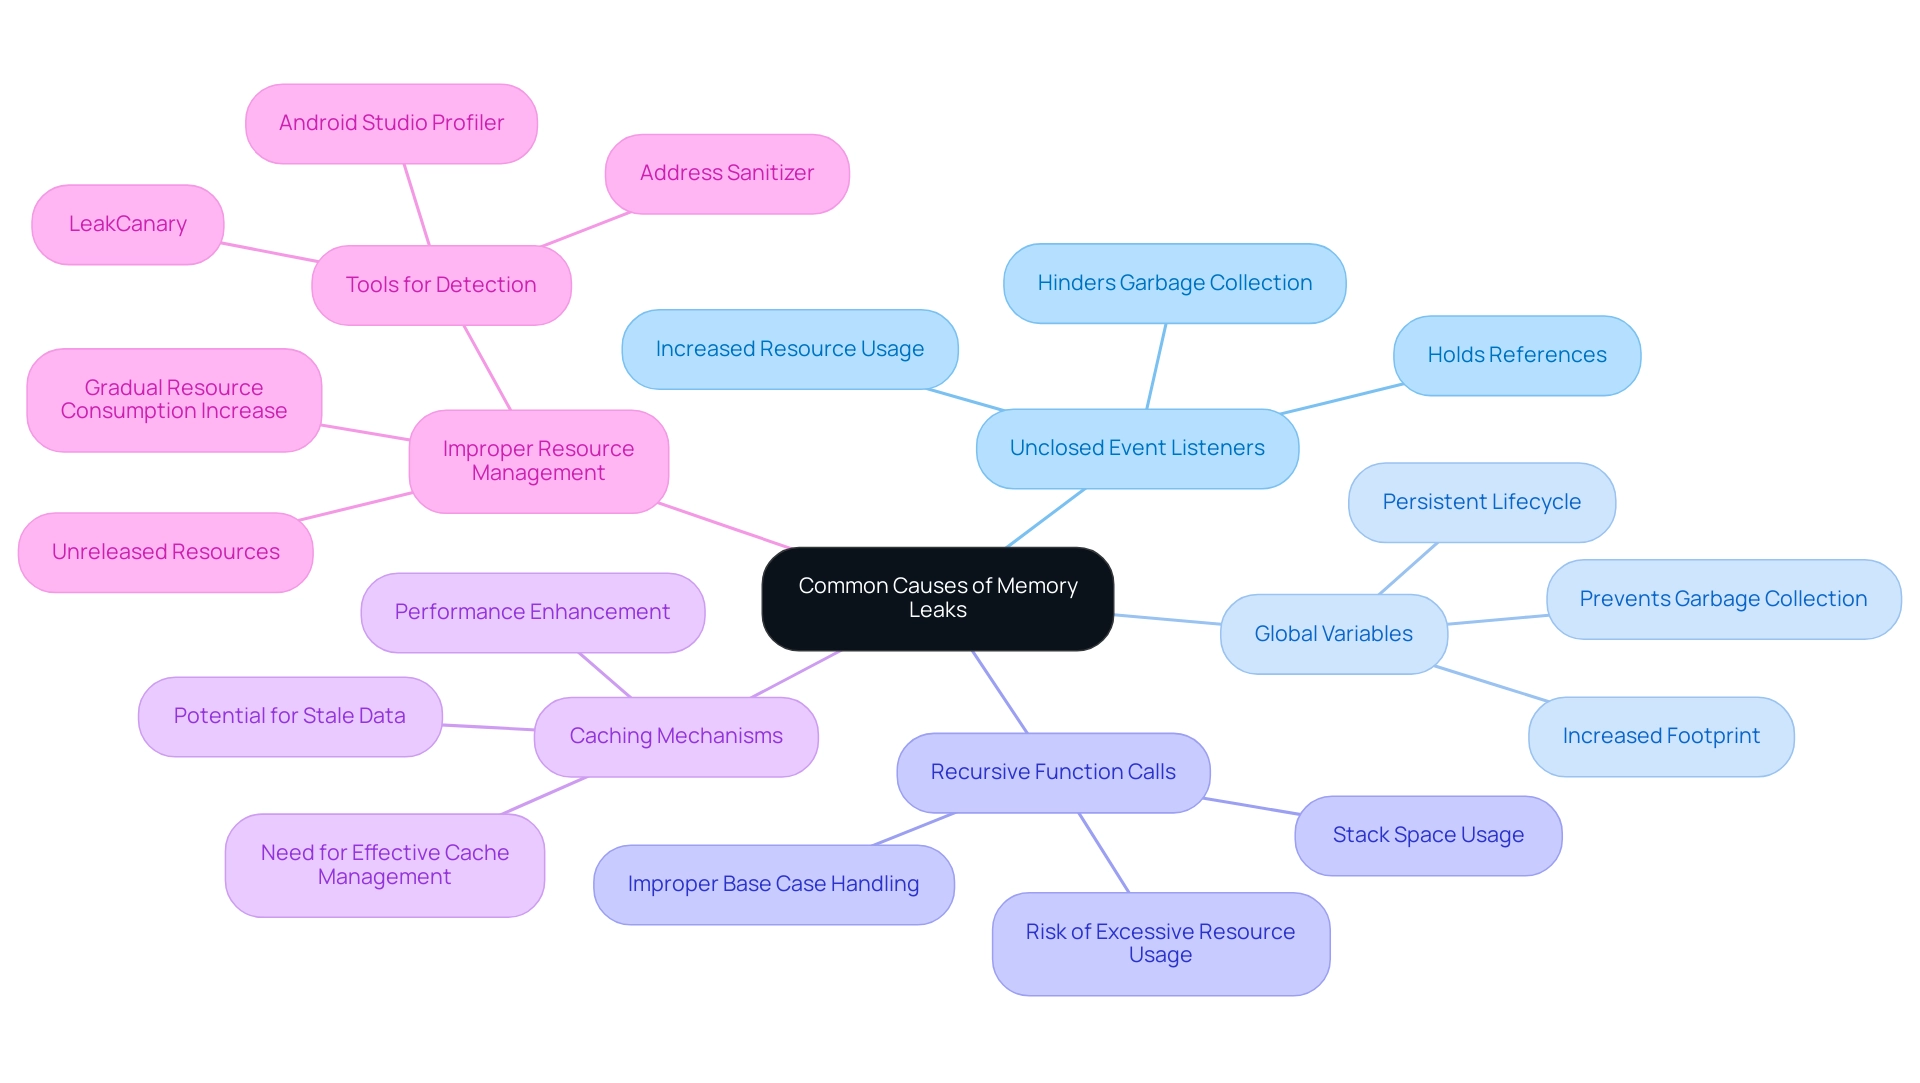
- Unclosed Event Listeners: Failing to remove event listeners can greatly contribute to difficulties when trying to locate memory leaks, as they hold references to objects that are suitable for garbage collection. When these references persist, storage that should be reclaimed remains occupied, leading to inefficient usage. Recent research emphasizes that unclosed event listeners are a frequent cause of increased resource usage in programs.
- Global Variables: Overreliance on global variables can hinder resource release since these variables persist for the application's entire lifecycle. This can prevent the garbage collector from reclaiming space from objects that are no longer in use, highlighting the need to locate memory leak issues, which ultimately results in increased footprint and potential performance degradation.
- Recursive Function Calls: Poorly handled recursive function calls present a danger for resource wastage, especially if the base case is not well defined. Each recursive call uses stack space and, if not concluded properly, can lead to excessive resource usage, making it necessary to locate memory leak issues that jeopardize system stability.
- Caching Mechanisms: While caching can enhance application performance by reducing load times, it can also unintentionally lead to leaks if cached items are not appropriately managed. Without effective strategies to locate memory leak or for cache invalidation and cleanup, stale data can accumulate, unnecessarily consuming resource capacity. As mentioned by Pranjal Sharma, "In my experience with Python, particularly in data and machine learning tasks, efficient resource management is crucial." This highlights the importance of implementing best practices for resource management, particularly in caching scenarios.
- Improper Resource Management: Failing to release resources such as database connections, file handles, or network sockets can gradually result in a gradual increase in resource consumption. Such resources, if not closed properly, can cause issues that require developers to locate memory leak, which degrades application performance over time. Tools such as Android Studio Profiler enable real-time tracking of resource usage, while LeakCanary notifies developers of resource issues by examining heap dumps. Furthermore, as illustrated in the case study named 'Detection of Resource Issues,' instruments such as Address Sanitizer can effectively aid in detecting resource problems, highlighting the significance of proper resource management.

Best Practices for Monitoring and Preventing Memory Leaks
- Consistently Observe Usage: To sustain peak application performance, it is crucial to employ strong monitoring resources that can track usage trends over time. Statistics show that resource issues arise when allocated space in a program is not correctly released, highlighting the need to locate memory leaks, which can significantly affect performance. These tools should alert developers to any unusual spikes, enabling quick intervention. Riya Garg, a writer for Women in Technology, stresses that
Avoiding excessive resource consumption is vital for sustaining [high-performance web platforms](https://teamhub.com/blog/understanding-memory-leak-detection-in-software-development), highlighting the importance of attentiveness in resource management. - Conduct Code Reviews: Establishing a routine of regular code evaluations is essential in recognizing potential resource failures before they escalate into serious issues. This practice not only enhances the quality of the code but also fosters a culture of accountability and excellence within the development team.
- Employ Automated Testing: Integrating automated testing frameworks that specifically focus on identifying resource issues can protect your software from new code problems. By automating this process, teams can ensure consistent testing and maintain high standards of software performance.
- Profile Applications Periodically: Regular profiling of applications is a proactive method to identify resource issues early in the development cycle. This early detection allows for timely remediation, minimizing the risk of performance degradation.
- Educate Team Members: Equipping team members with a thorough understanding of information management principles is crucial. Frequent training sessions can assist developers in steering clear of common traps related to resource mismanagement, ultimately resulting in more effective software development practices. Moreover, tools such as Teamhub can improve collaboration among team members, facilitating the communication essential for effective oversight strategies and directly aiding efforts to eradicate information loss. Incorporating AI algorithms into your processes can also significantly enhance the accuracy to locate memory leaks. A case study titled 'The Role of AI in Memory Leak Detection' illustrates that AI algorithms can learn from code patterns and memory usage to help locate memory leak problems, reducing false positives while providing intelligent suggestions for fixes. This not only elevates your team's productivity but also enhances overall application performance.
Conclusion
Memory management is paramount in software development, particularly when it comes to addressing the pervasive issue of memory leaks. By understanding the causes of memory leaks, such as:
- unclosed event listeners
- improper resource management
developers can take proactive measures to prevent performance degradation and application crashes. Utilizing essential tools like:
- heapdump
- garbage collection logs
- profiling tools
can facilitate the identification and resolution of memory-related inefficiencies.
Regular monitoring of memory usage and conducting thorough code reviews are vital practices that contribute to maintaining a robust application. Automated testing and periodic profiling ensure that potential leaks are caught early, while ongoing education for team members fosters a culture of accountability and excellence in coding practices.
Ultimately, the commitment to effective memory management not only enhances application stability and performance but also elevates the user experience. By adopting best practices and leveraging advanced tools, developers can safeguard their applications against the silent threat of memory leaks, ensuring optimal efficiency and productivity in their software development endeavors.
Frequently Asked Questions
What are resource retention issues in software development?
Resource retention issues occur when a program allocates memory but fails to release it after use, leading to increased resource usage and potential system failures, especially in long-running processes.
What are the key indicators of memory leaks?
Key indicators include persistent increases in memory usage over time, noticeable sluggishness in application responsiveness, and unexpected crashes.
Why is it important for developers to recognize memory leak symptoms early?
Early recognition allows developers to locate memory leak issues and implement proactive measures to resolve them swiftly, thereby enhancing software performance and security compliance.
What steps can developers take to prevent resource leaks?
Developers can prevent resource leaks by establishing limits on resource creation, managing references carefully, and utilizing automated code debugging tools for identifying and fixing issues.
What tools can help in locating memory leaks?
Tools such as Chrome DevTools, v8-profiler, clinic.js, and Node.js Inspector can help developers visualize resource allocation, monitor memory usage in real-time, and analyze heap snapshots to identify memory leaks.
How can deferred function calls contribute to resource exhaustion?
Deferring a large number of functions, especially in loops, can exhaust system resources. It is recommended to handle file processing in separate functions to ensure resources are managed effectively.
What common coding practices contribute to memory leaks?
Common practices include leaving event listeners unclosed, overusing global variables, poorly handled recursive function calls, and improper resource management for database connections or file handles.
How can automated testing help with memory leak detection?
Automated testing frameworks can specifically focus on identifying resource issues, ensuring consistent testing and maintaining high software performance standards.
What is the role of education in preventing memory leaks?
Educating team members on information management principles and conducting frequent training can help developers avoid common traps related to resource mismanagement.
How can AI contribute to memory leak detection?
AI algorithms can learn from code patterns and memory usage, helping to identify memory leak problems more accurately and providing intelligent suggestions for fixes.


