Overview
Developers often encounter significant challenges when it comes to optimizing performance in their applications. The article focuses on mastering the go tool trace for performance optimization in Go applications through a structured five-step approach. It details the process of:
- Setting up the tool
- Collecting trace data
- Analyzing trace data
- Implementing performance optimizations
- Evaluating results
Furthermore, these steps can lead to significant efficiency improvements, as evidenced by case studies showing up to a 30% enhancement in application responsiveness after refactoring. By utilizing this tool, developers can effectively address their performance issues and enhance the overall quality of their applications.
Introduction
In the realm of software development, performance optimization is a critical pursuit that can make or break an application. Developers often face challenges in identifying performance bottlenecks that hinder efficiency. For those using the Go programming language, the go tool trace command emerges as an indispensable ally in this quest. This powerful utility not only visualizes program execution but also unveils the intricate details of goroutine scheduling and system calls. By mastering the setup and analysis of trace data, developers can identify and rectify issues that obstruct their applications' performance, ensuring they run smoothly and securely. This article delves into the essential steps for utilizing go tool trace, from the initial setup to actionable performance enhancements, equipping developers with the knowledge to optimize their Go applications effectively.
Understand the Basics of go tool trace
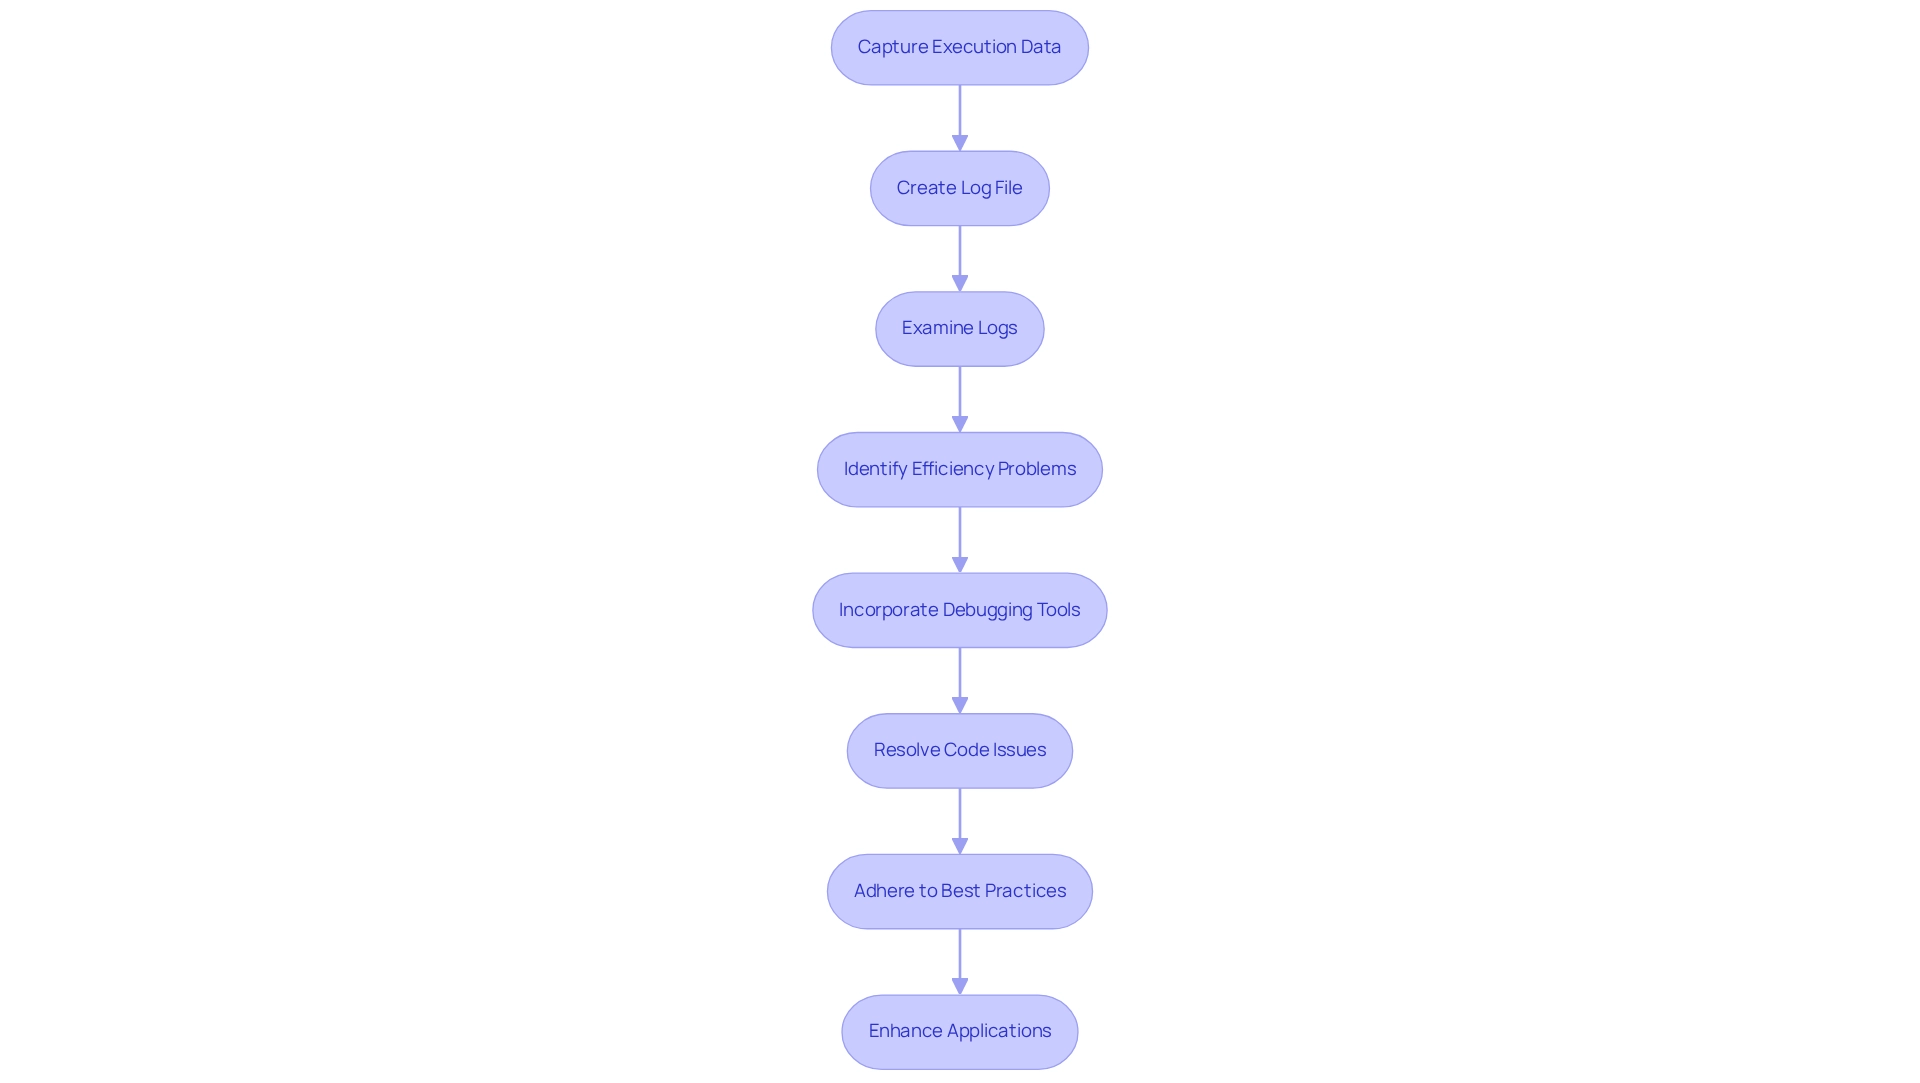
Coding challenges are an inherent part of a developer's journey. The go tool trace command in the Go programming language is a powerful utility that helps tackle these challenges by enabling developers to visualize program execution. It captures detailed information about goroutine scheduling, system calls, and other runtime events. By creating a log file, developers can examine how their code operates over time, which is crucial for identifying efficiency problems such as latency and contention.
Furthermore, incorporating automated code debugging tools can assist in promptly identifying and resolving codebase issues. This ensures that your software adheres to the latest security best practices and coding standards. Understanding how to analyze the data logs with the go tool trace is the first step toward enhancing your Go applications efficiently. This knowledge empowers developers to solve problems swiftly and achieve better results.
Set Up Your Environment for go tool trace
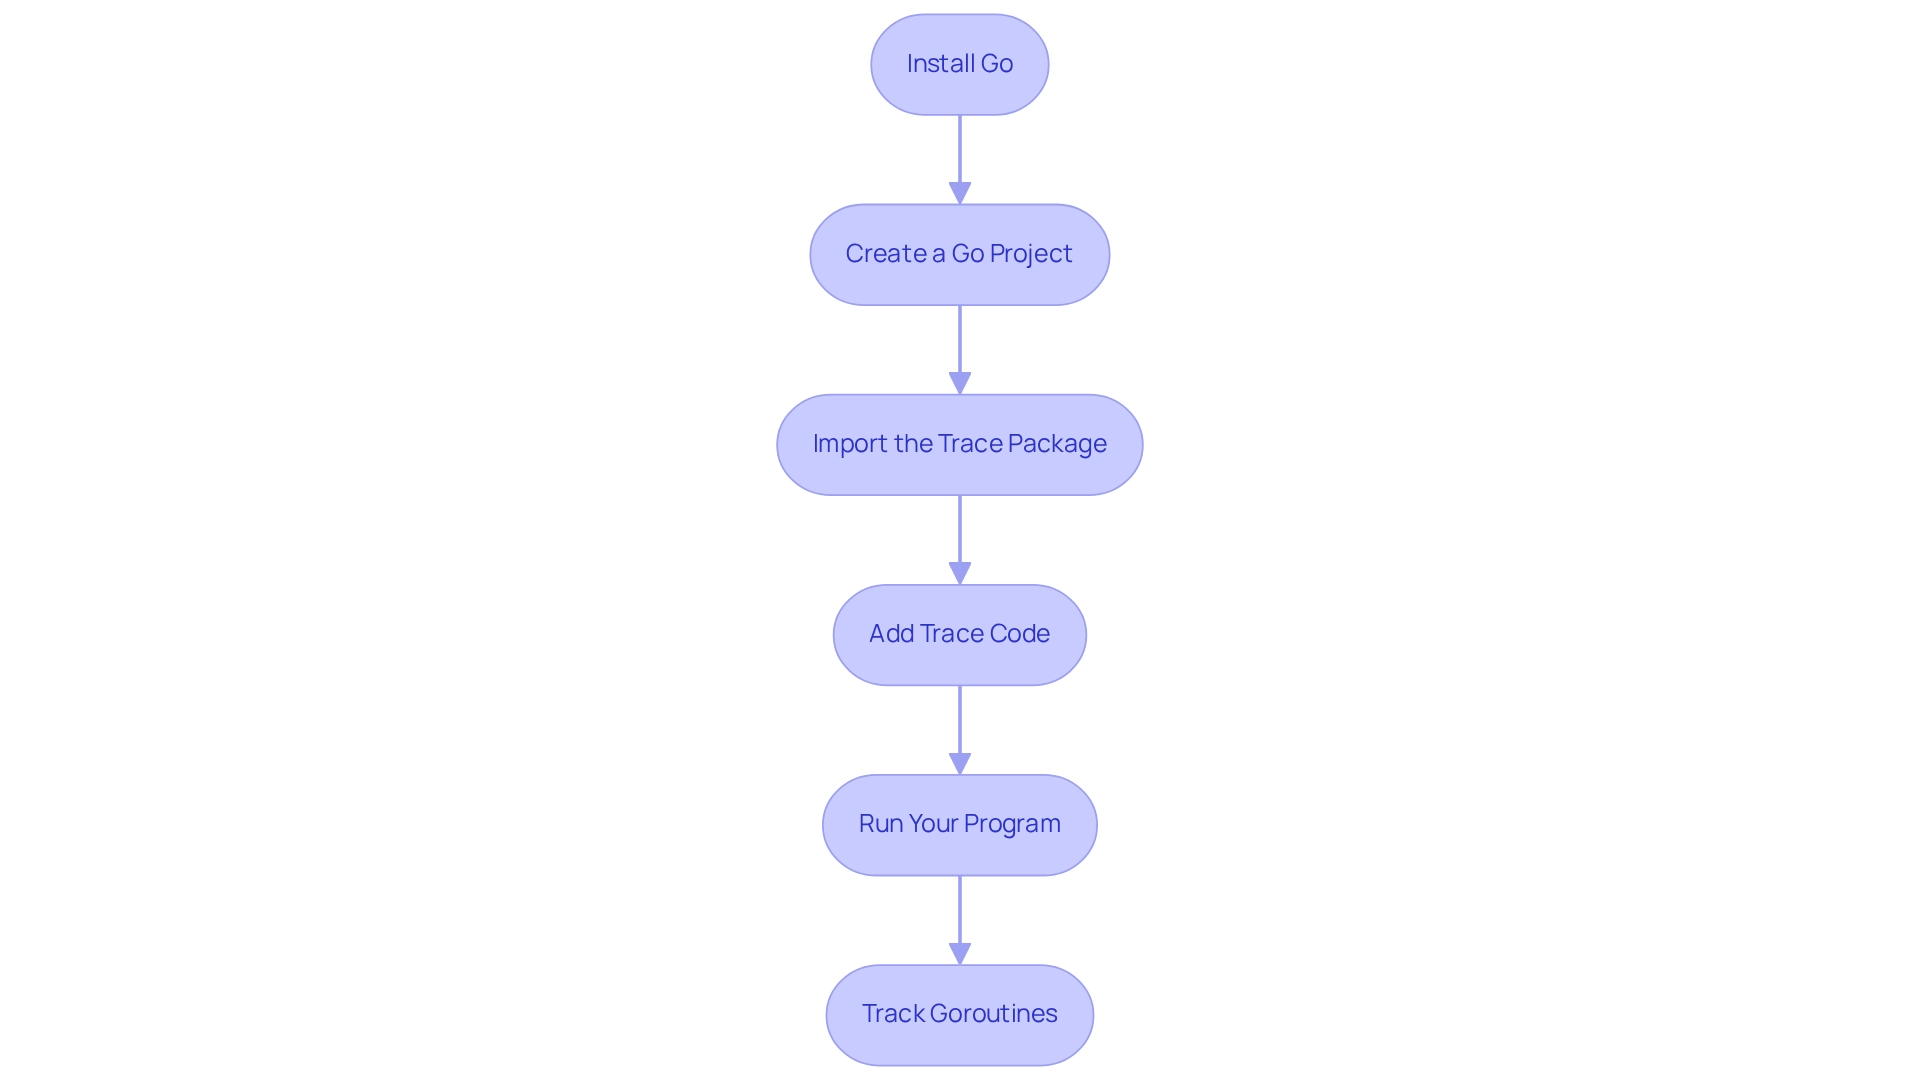
Setting up your environment is essential for optimizing your Go projects when using go tool trace. Are you facing challenges in monitoring performance? Follow these steps to ensure a smooth setup that enhances your coding experience:
-
Install Go: First, make sure you have the latest version of Go installed on your machine. Download it from the official Go website to access the most recent features and improvements.
-
Create a Go Project: Next, set up a new Go project or navigate to an existing one. If necessary, initialize a module using
go mod init <module-name>to manage dependencies effectively. -
Import the Trace Package: In your Go code, import the
runtime/tracepackage to enable tracing functionality, which is crucial for performance monitoring. -
Add Trace Code: Wrap the main execution logic of your program with trace start and stop calls:
package main import ( "os" "runtime/trace" ) func main() { f, err := os.Create("trace.out") if err != nil { panic(err) } defer f.Close() trace.Start(f) defer trace.Stop() // Your application logic here } -
Run Your Program: Finally, execute your Go program to create the log file. Use
go run main.goto generate the trace output, which can be examined for insights on efficiency.
Furthermore, tracking the quantity of goroutines during execution with runtime.NumGoroutine can aid in identifying leaks and ensuring proper utilization, thereby improving the overall efficiency of your application. According to a case study titled "Monitoring Runtime Statistics in Go," tracking metrics such as memory allocation and goroutine activity can provide valuable insights into the health and performance of your Go programs. By following these steps, you can effectively set up your environment for go tool trace, enabling you to optimize your Go projects with confidence. Are you ready to enhance your coding efficiency?
Collect Trace Data Using go tool trace
To collect trace data using go tool trace, follow these steps:
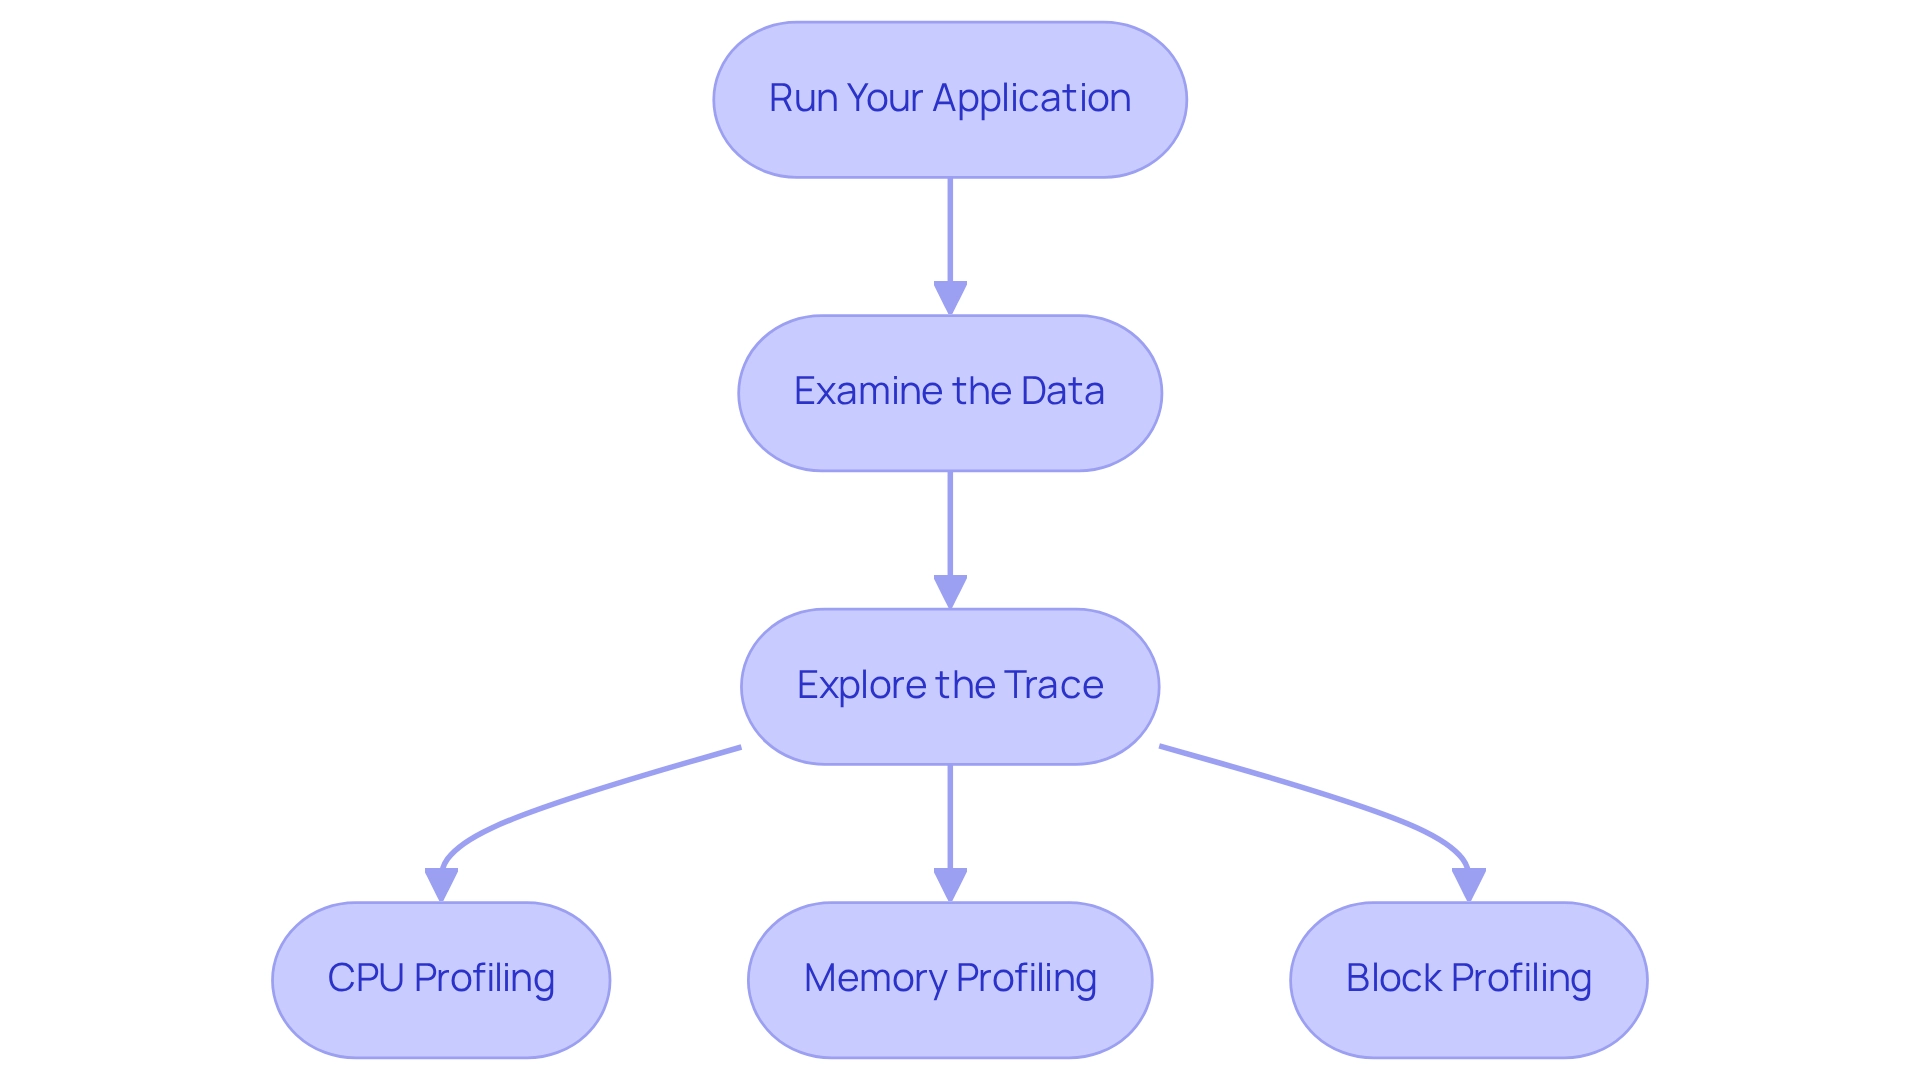
- Run Your Application: Start your Go application as outlined previously. This action creates a log file named
trace.outin your project directory, which is essential for subsequent analysis. - Examine the Data: Run the command
go tool trace trace.outto access a web-based interface that visualizes the data. This command will open your default web browser, showing a detailed timeline. - Explore the Trace: Within the web interface, navigate through various views, including goroutine states, blocking events, and CPU utilization. This investigation is essential for comprehending your program's functionality under various circumstances.
Profiling should be conducted with multiple sample runs to ensure consistency in the results. As noted, profiling can be categorized into CPU profiling, memory profiling, and block profiling, which are essential for a thorough analysis. By utilizing the knowledge acquired from the monitoring information, developers can efficiently pinpoint efficiency issues and enhance their software for improved resource management.
The effectiveness of go tool trace in gathering and examining trace information is showcased through practical uses, particularly in identifying goroutine leaks, as demonstrated in the case study titled 'Goroutine Analysis.' By utilizing the goleak library to validate tests and gathering goroutine dumps, developers can guarantee improved resource management and efficiency in concurrent applications.
As Voltaire wisely stated, "Those who can make you believe absurdities can make you commit atrocities," emphasizing the significance of precise information gathering and analysis in enhancing effectiveness.
Analyze Trace Data for Performance Insights
Coding challenges can often lead to frustration for developers. Once you have gathered your data, follow these steps to analyze it for performance insights:
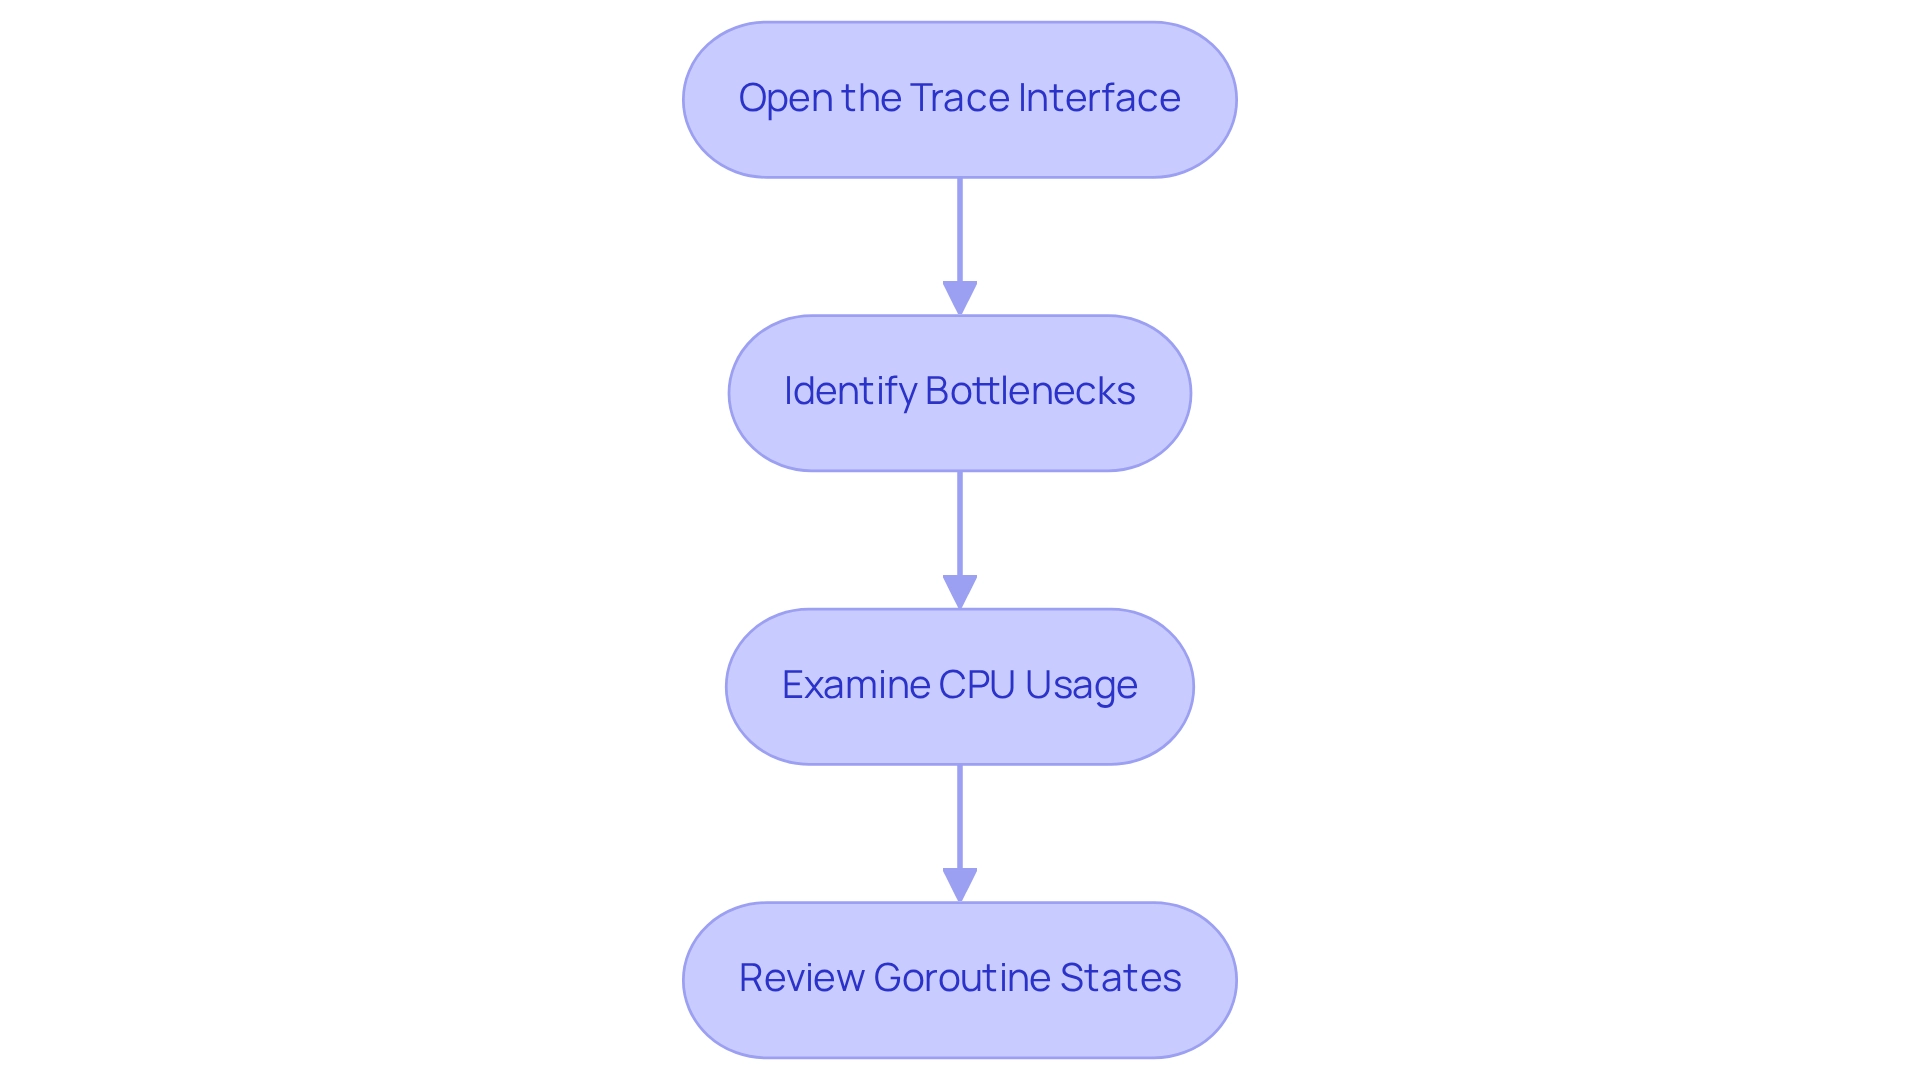
- Open the Trace Interface: After executing
go tool trace trace.out, the trace visualization will appear in your browser. Familiarize yourself with the interface, which includes various graphs and timelines. - Identify Bottlenecks: Look for areas in the timeline where goroutines are blocked or waiting. These points often indicate contention or inefficient resource usage. With Kodezi's automated code debugging, you can instantly identify and fix these issues, gaining detailed insights into what went wrong and how to resolve it effectively.
- Examine CPU Usage: Analyze the CPU utilization graph to see how effectively your software utilizes CPU resources. High CPU usage with low throughput may suggest optimization opportunities. Kodezi can assist in improving efficiency by addressing bottlenecks and ensuring your code complies with the latest security best practices and coding standards.
- Review Goroutine States: Check the states of goroutines to identify any that are in a waiting state for extended periods. This can highlight synchronization issues or deadlocks that need to be addressed. By leveraging Kodezi's capabilities, you can quickly debug and optimize your code, ensuring efficient development and compliance with security standards.
Are you ready to enhance your coding practices with Kodezi? Explore the tools available on the platform to boost your productivity and code quality.
Implement Performance Optimizations Based on Trace Analysis
To enhance application performance after analyzing data with the go tool trace, developers often encounter challenges that can hinder efficiency. By implementing specific optimizations, significant improvements can be achieved.
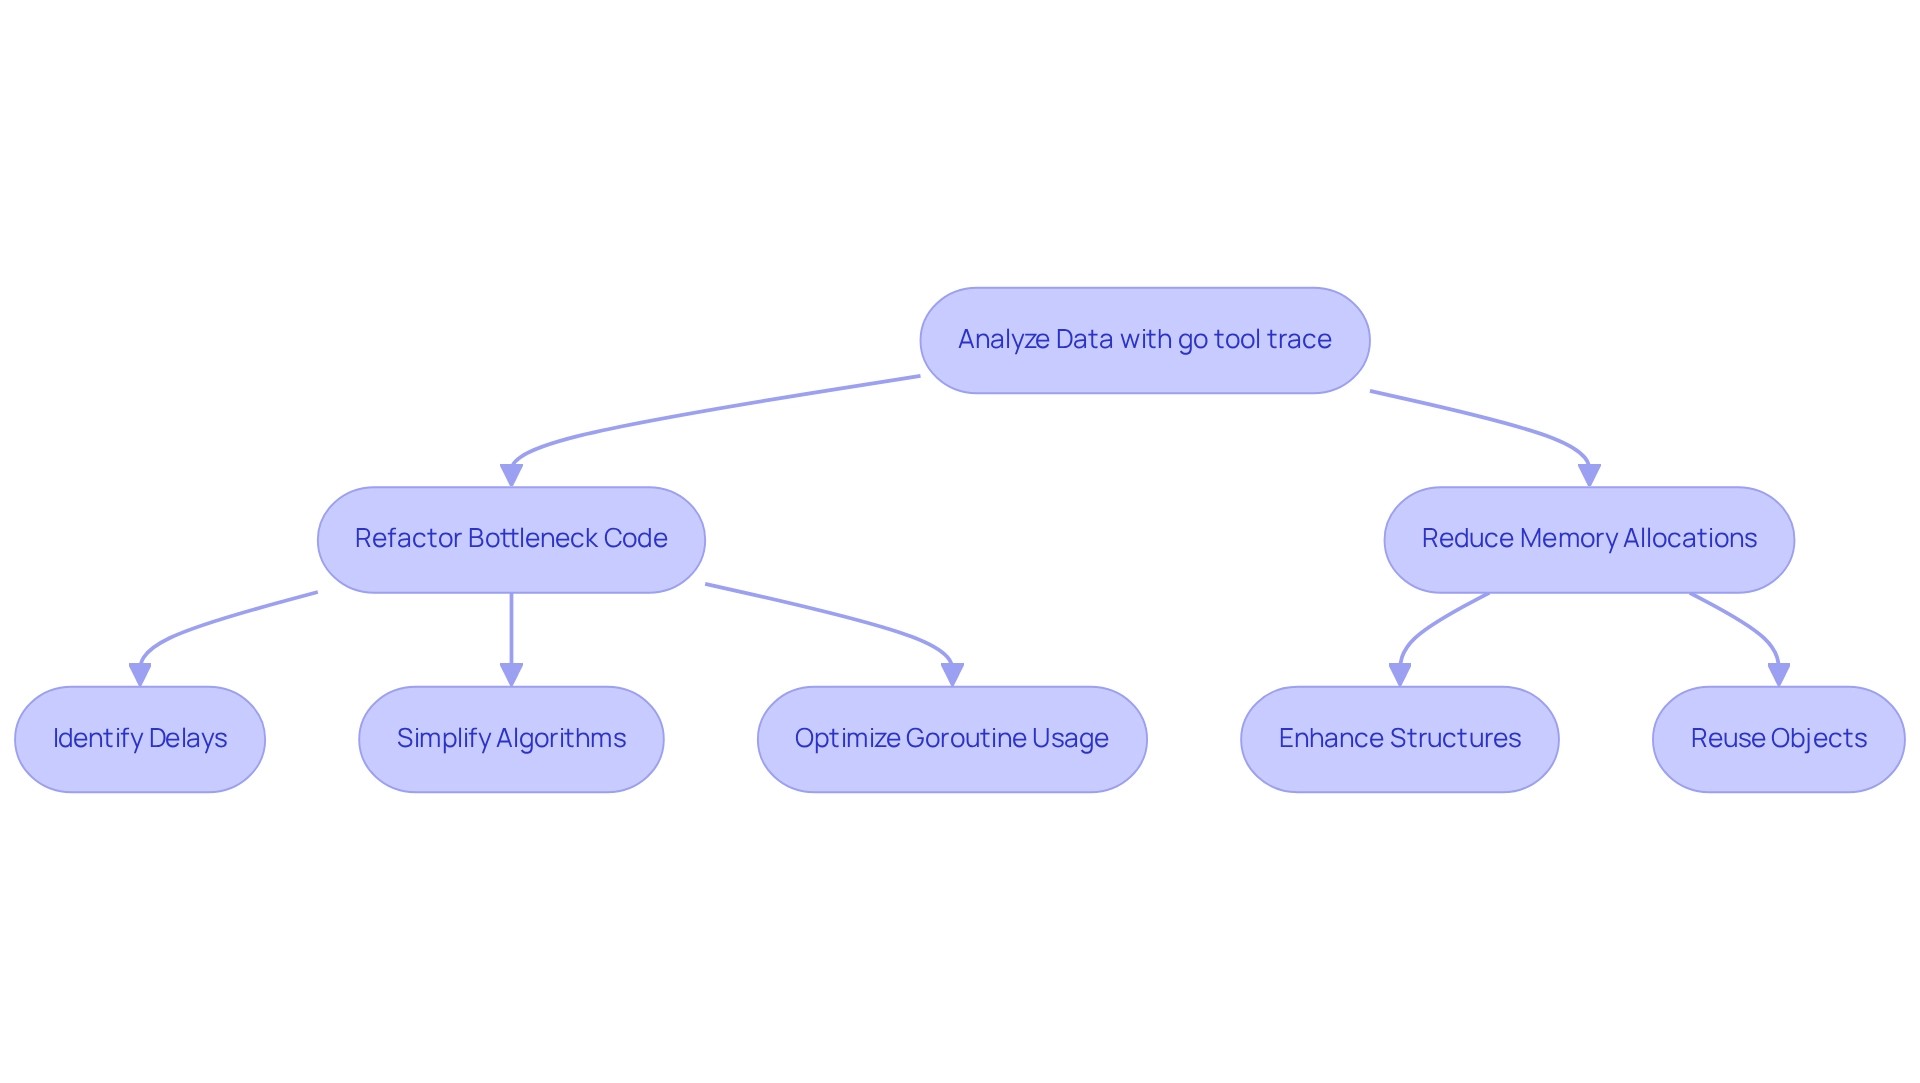
Refactor Bottleneck Code: Identify the code segments responsible for delays and refactor them for improved efficiency. This may involve simplifying algorithms or reducing complexity to streamline execution. As highlighted in the case study 'Design Thinking for Developers,' programming can be viewed as an art form, where thoughtful design leads to better performance. To optimize goroutine usage, employing the go tool trace can help identify frequent blocking of goroutines, allowing for the use of channels or other synchronization mechanisms to enhance concurrency and reduce wait times. This aligns with software architecture patterns like pipe-and-filter, which facilitate information transformation in programs.
Reduce Memory Allocations: High rates of memory allocation can lead to increased garbage collection overhead. Enhance your structures and reuse objects whenever feasible to minimize unnecessary allocations. Remember, as Kevlin Henney suggests, revisiting the original premise can yield surprising insights that improve efficiency; after applying modifications, make sure to use the go tool trace to rerun your program and collect new trace data to verify that the optimizations have achieved the desired enhancements. This iterative approach is essential for improving system efficiency. A satisfactory initial version will require more time to create with $170K than it would have with $0K, underscoring the importance of dedicating time to enhancements.
By adhering to these steps, developers can significantly improve the efficiency of their Go programs. Many report average enhancements of up to 30% after refactoring. Successful case studies illustrate the effectiveness of these strategies, demonstrating that thoughtful performance optimizations can lead to substantial gains in application responsiveness and resource utilization.
Conclusion
Developers often face significant challenges in optimizing the performance of their Go applications. Utilizing the go tool trace command is essential for addressing these challenges. By understanding the basics of this powerful utility, setting up the environment correctly, and effectively collecting and analyzing trace data, developers can identify performance bottlenecks that impede application efficiency. Each step, from integrating trace functionality to monitoring goroutine usage, contributes to a clearer picture of how applications operate in real-time.
Furthermore, the analysis of trace data provides invaluable insights into areas that require optimization. This enables developers to implement targeted performance enhancements. By refactoring code, optimizing goroutine usage, and reducing memory allocations, significant improvements can be achieved. The iterative process of profiling and refining ensures that applications not only meet but exceed performance expectations, leading to better resource management and user experience.
In conclusion, mastering go tool trace equips developers with the tools necessary to elevate their applications' performance. As the landscape of software development continues to evolve, the ability to effectively analyze and optimize code is paramount. By embracing these practices, developers can ensure their Go applications run smoothly, efficiently, and securely. Are you ready to set the stage for continued success in the competitive world of software development?
Frequently Asked Questions
What is the purpose of the go tool trace command in Go programming?
The go tool trace command is a powerful utility that helps developers visualize program execution by capturing detailed information about goroutine scheduling, system calls, and other runtime events.
How does go tool trace assist in identifying efficiency problems?
By creating a log file, go tool trace allows developers to examine how their code operates over time, which is crucial for identifying efficiency problems such as latency and contention.
What steps should I follow to set up my environment for using go tool trace?
The steps to set up your environment include: 1. Install the latest version of Go from the official website. 2. Create a new Go project or navigate to an existing one, initializing a module if necessary. 3. Import the runtime/trace package in your Go code. 4. Add trace code by wrapping the main execution logic with trace start and stop calls. 5. Run your program to create the log file using go run main.go.
What is the significance of tracking the quantity of goroutines during execution?
Tracking the quantity of goroutines using runtime.NumGoroutine can help identify leaks and ensure proper utilization, thereby improving the overall efficiency of your application.
How does automated code debugging help in software development?
Incorporating automated code debugging tools helps promptly identify and resolve codebase issues, ensuring that software adheres to the latest security best practices and coding standards.
What insights can tracking metrics like memory allocation and goroutine activity provide?
Tracking metrics such as memory allocation and goroutine activity can provide valuable insights into the health and performance of Go programs, helping developers optimize their applications effectively.


