Overview
The article highlights the challenges developers face with coding, particularly in optimizing, monitoring, and troubleshooting pgx connection pools. These issues can significantly impact database performance and resource management. How can developers effectively tackle these challenges? Kodezi offers solutions that streamline the process. By configuring optimal connection settings, monitoring key performance metrics, and addressing common issues like resource leaks and timeout errors, Kodezi enhances application reliability and user experience.
Furthermore, the benefits of using Kodezi extend beyond mere troubleshooting. Improved productivity and code quality are at the forefront of its features. Imagine a scenario where developers can resolve connection issues swiftly, leading to fewer disruptions and a more efficient workflow. This not only boosts individual performance but also contributes to a more robust overall application.
In addition, Kodezi’s tools are designed with the developer in mind, making them accessible and user-friendly. Wouldn't it be advantageous to explore these tools and see how they can transform your coding practices? By leveraging Kodezi, developers can ensure their applications run smoothly, ultimately enhancing the user experience.
Take action today—explore the tools available on the Kodezi platform and discover how they can help you optimize your coding processes.
Introduction
In the realm of database management, developers often grapple with significant challenges related to application performance and resource efficiency. Connection pooling emerges as a vital strategy to address these issues. By maintaining a pool of reusable connections, applications can minimize the costly overhead associated with repeatedly opening and closing connections. This technique not only accelerates response times but also optimizes resource utilization, making it essential for developers aiming to create scalable and responsive applications.
Furthermore, as organizations increasingly rely on robust database interactions, understanding the intricacies of connection pooling—from configuration settings to monitoring health—becomes paramount. This knowledge ensures seamless performance and reliability.
This article delves into the fundamentals of connection pooling, offering insights into:
- Optimal configuration
- Health monitoring
- Troubleshooting common issues that can arise in this critical area of application development.
Are you ready to enhance your application’s performance?
Understand Connection Pooling Basics
Pooling, specifically using a pgx connection pool, is a crucial technique for managing database links efficiently. Rather than establishing and terminating a link for every request, a pgx connection pool is maintained, enabling programs to utilize a link, employ it, and send it back for further use. This method greatly decreases the overhead related to setting up links in the pgx connection pool, resulting in improved performance and resource usage.
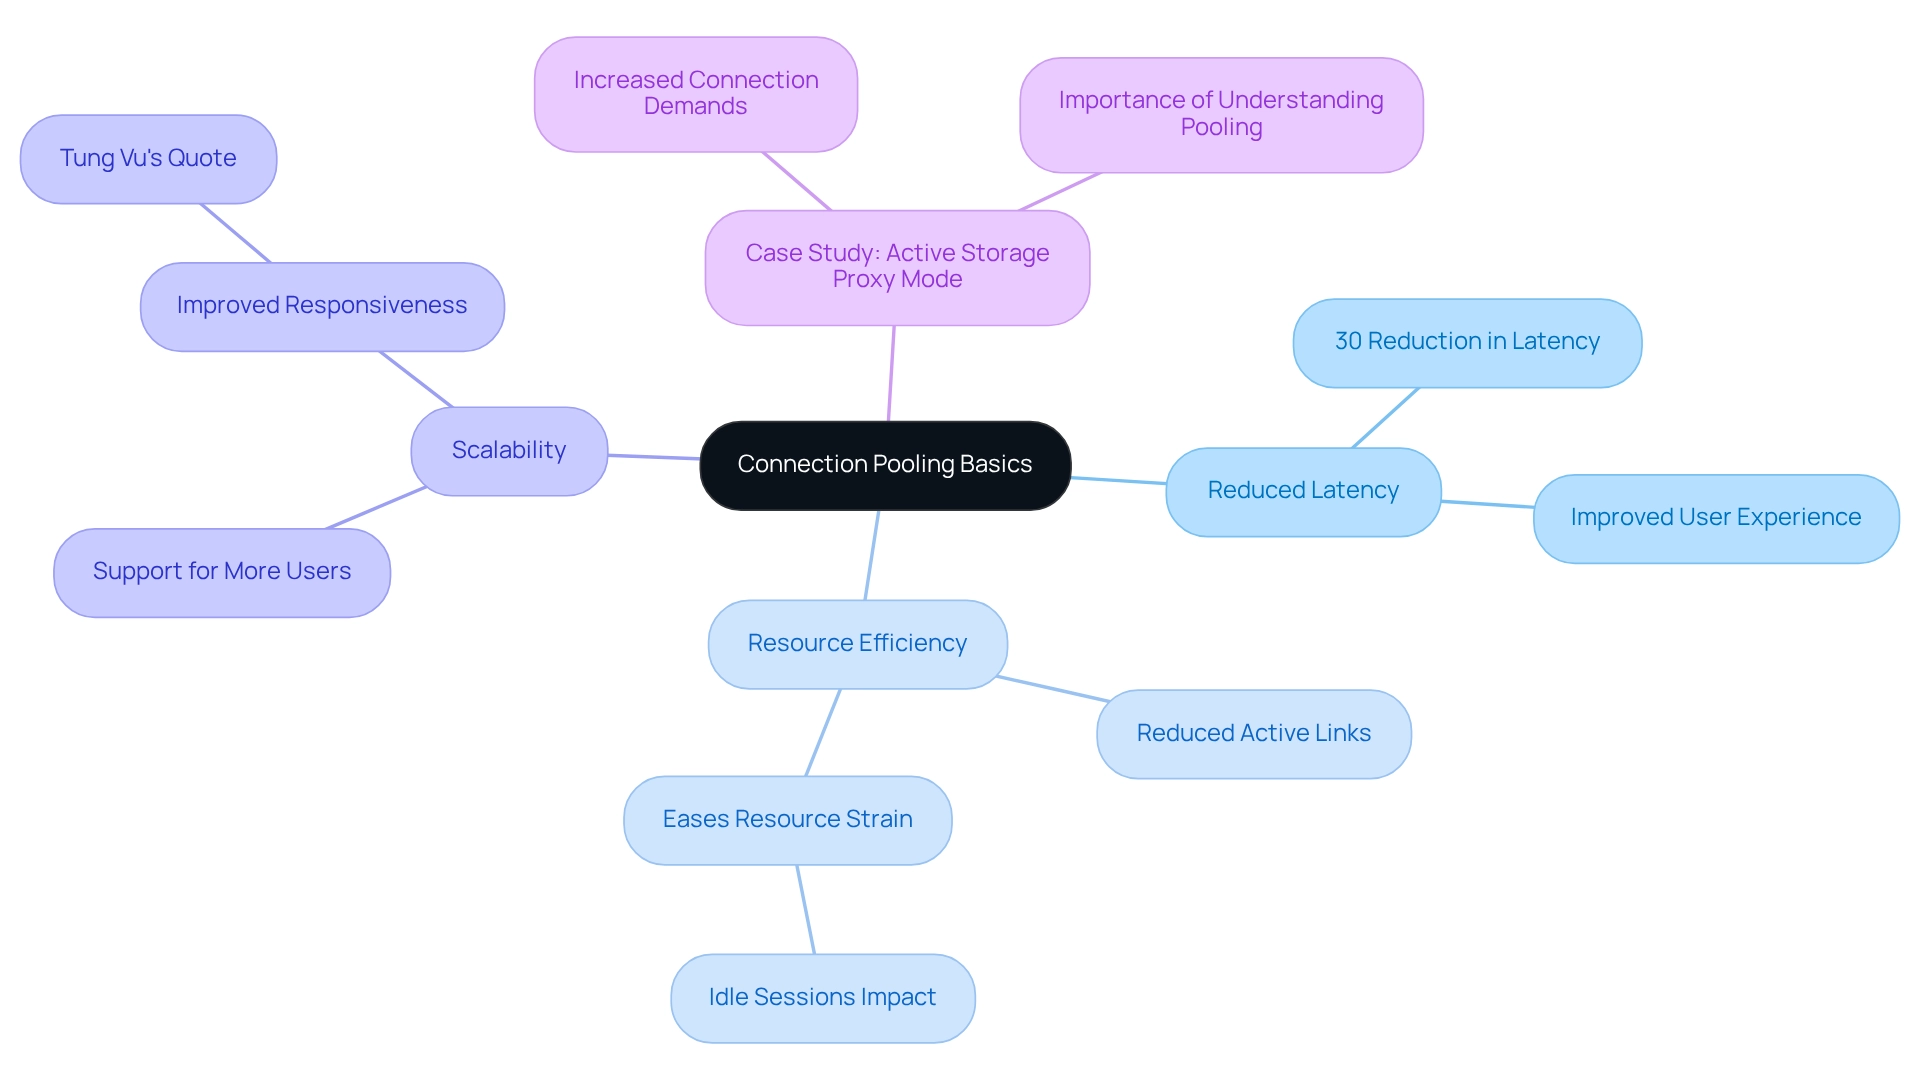
- Reduced Latency: By reusing existing connections, applications can respond more quickly to requests, improving overall user experience. In fact, statistics from 2025 indicate that efficient resource pooling can lead to a 30% reduction in latency for database-driven systems.
- Resource Efficiency: The use of a pgx connection pool reduces the number of active links, easing the resource strain on the server. This is particularly important as many open sessions with idle status can slow down the snapshot created for each SQL statement, as highlighted by Albe's insights at pgconfEU.
- Scalability: Utilizing a pgx connection pool allows systems to support additional simultaneous users without overloading the database, thereby improving scalability. Professionals stress that when executed properly, the pgx connection pool can greatly improve both the responsiveness and dependability of these systems. As Tung Vu, a Software Engineer, observed, "If it is executed properly, pooling resources can greatly improve both the responsiveness and reliability of your database-driven applications."
For example, in a case study concerning Active Storage Proxy Mode in Rails, it was discovered that comprehending how Active Storage functions in proxy mode is crucial for setting up the data link resources correctly, as it may result in heightened demands for links beyond the primary request. This emphasizes the significance of mastering pooling fundamentals to enhance and resolve database performance efficiently.

Configure Optimal Connection Pool Settings
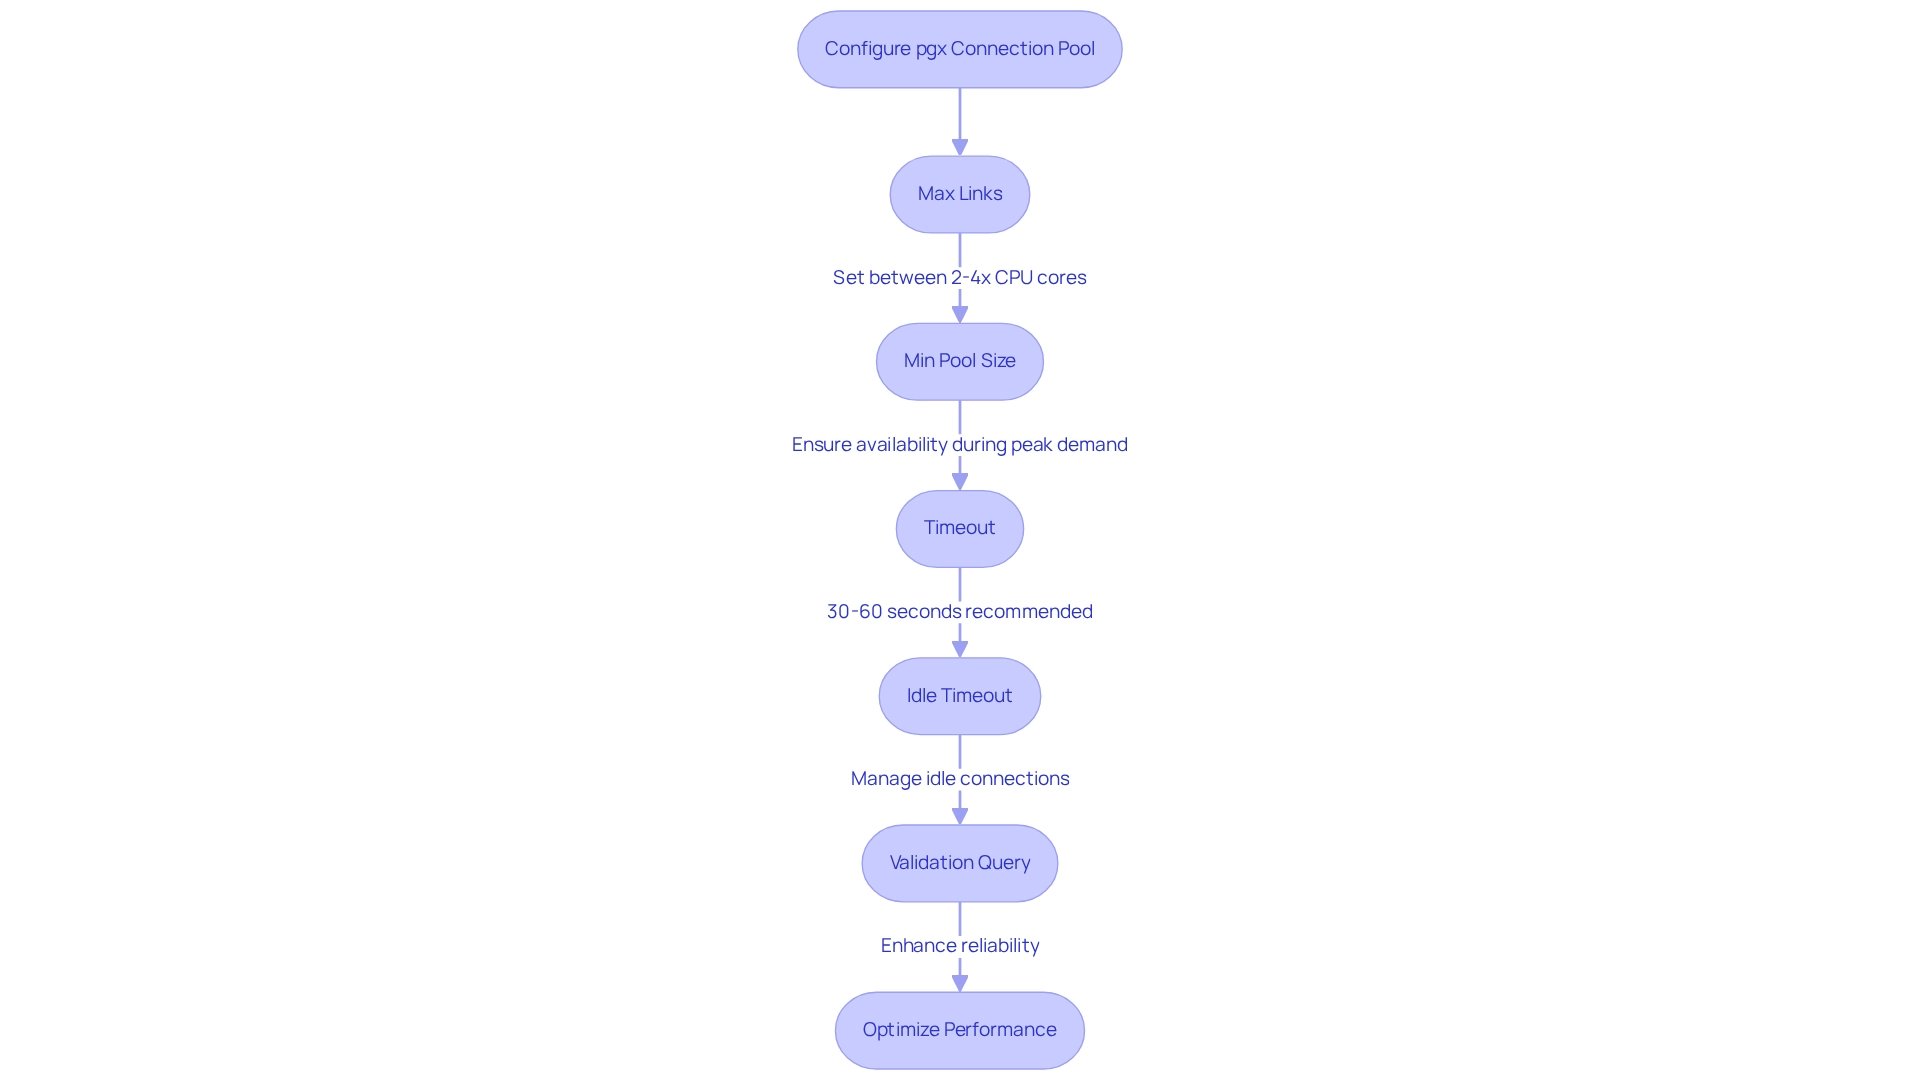
To optimize your resource group setup, it's essential to consider several key settings, including those for the pgx connection pool. In the pgx connection pool, establish the maximum number of links allowed. A commonly recommended guideline is to set this between 2 to 4 times the number of available CPU cores. This range aids in balancing resource utilization and application performance. Interestingly, you can achieve 1,000 RPS on a single CPU system with just one link, provided your queries execute in 1ms or less.
- Min Pool Size: Define the minimum number of links to keep in the pgx connection pool. This ensures that links are readily available during peak demand, thus minimizing latency for users.
- Timeout: Set the duration the application should wait for a pgx connection pool link to become available before generating an error. A typical range for the pgx connection pool is 30 to 60 seconds, which allows for efficient handling of temporary demand spikes.
- Idle Timeout: Determine the maximum time a link in the pgx connection pool can remain idle before being closed. This setting is crucial for efficient resource management and avoiding unnecessary connection resource usage.
Implement a validation query to assess the health of links in the pgx connection pool prior to allocation. This practice ensures that outdated or faulty links are not utilized, enhancing your application's reliability.
By fine-tuning these parameters, you can significantly improve the performance and reliability of your application's database interactions, leading to a smoother user experience. Additionally, leveraging Kodezi's AI-powered tools for automatic code correction and bug analysis can further boost developer productivity. Are you looking to streamline your coding processes? Consider using the Kodezi CLI, which provides a versatile solution for auto-healing codebases. Don't miss out on Kodezi's free trials and demos to experience these advantages firsthand. For further details on effectively utilizing Kodezi in resource management, refer to our documentation.

Monitor and Maintain Connection Pool Health
Supervising your resource group is crucial for achieving optimal performance and efficiency. Have you ever considered the key metrics you should monitor? Here are some essential indicators:
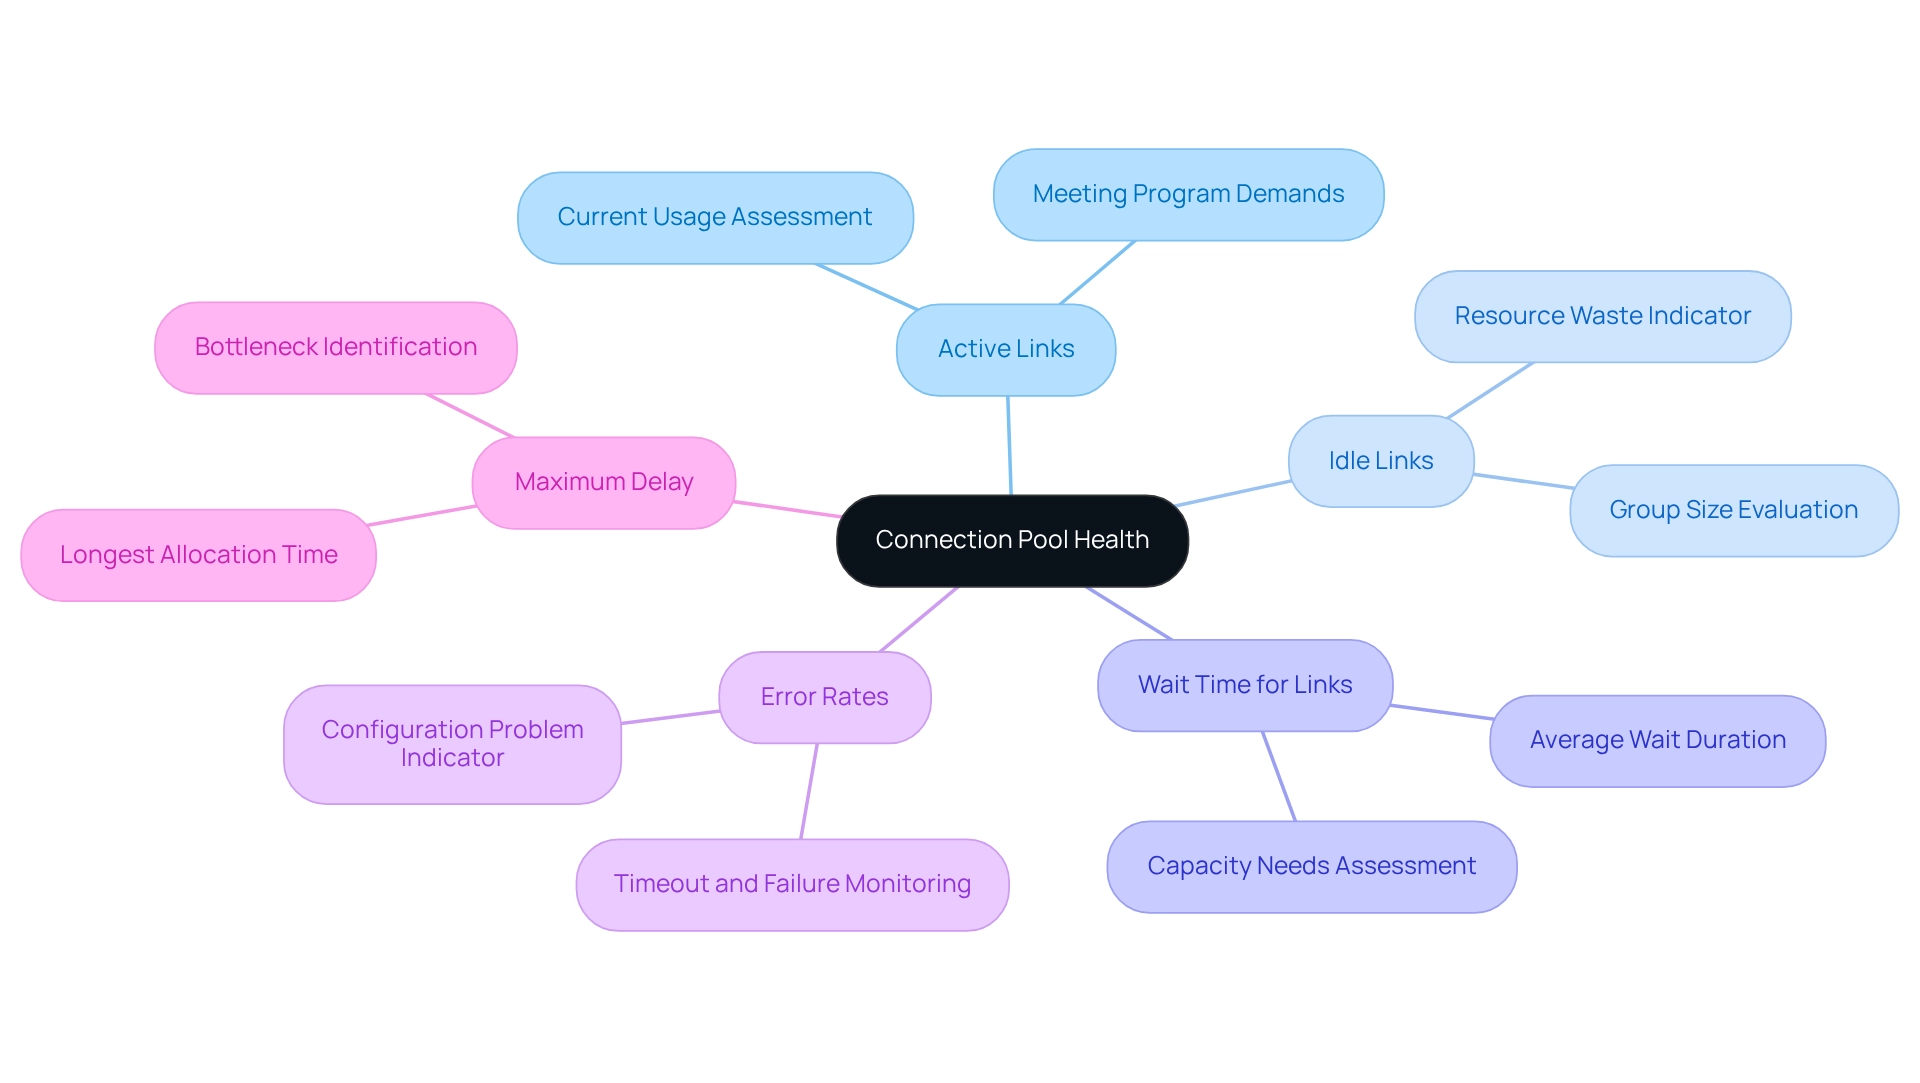
- Active Links: This metric shows the number of links currently in use, helping you assess if the resource size meets your program's demands.
- Idle Links: This counts the links that are not actively in use. A significant number of inactive links may suggest that the group is too large, potentially wasting resources.
- Wait Time for Links: This measures the average duration applications wait for a link. Lengthy wait times can signal that the facility is undersized, indicating a need for increased capacity.
- Error Rates: Monitoring for mistakes related to timeouts or failures is essential. Increased error rates may reveal hidden configuration problems that require your attention.
- Maximum Delay: This statistic reflects the longest time taken to allocate a link in the resource set during the last assessment period, providing insight into possible bottlenecks in link allocation.
To visualize and analyze these metrics effectively, consider using monitoring tools like Prometheus and Grafana. These platforms facilitate real-time monitoring and provide insights into resource health. For instance, measurements can include current links in the resource, resource usage, wait requests for links, and handled requests. Additionally, the IBM Redbooks resources on WebSphere Application Server offer valuable best practices for monitoring resource groups, fostering a community of developers who share insights and experiences.
By consistently assessing these metrics, you can make informed adjustments to your resource settings, ensuring ongoing performance and reliability in your database systems.

Troubleshoot Common Connection Pool Issues
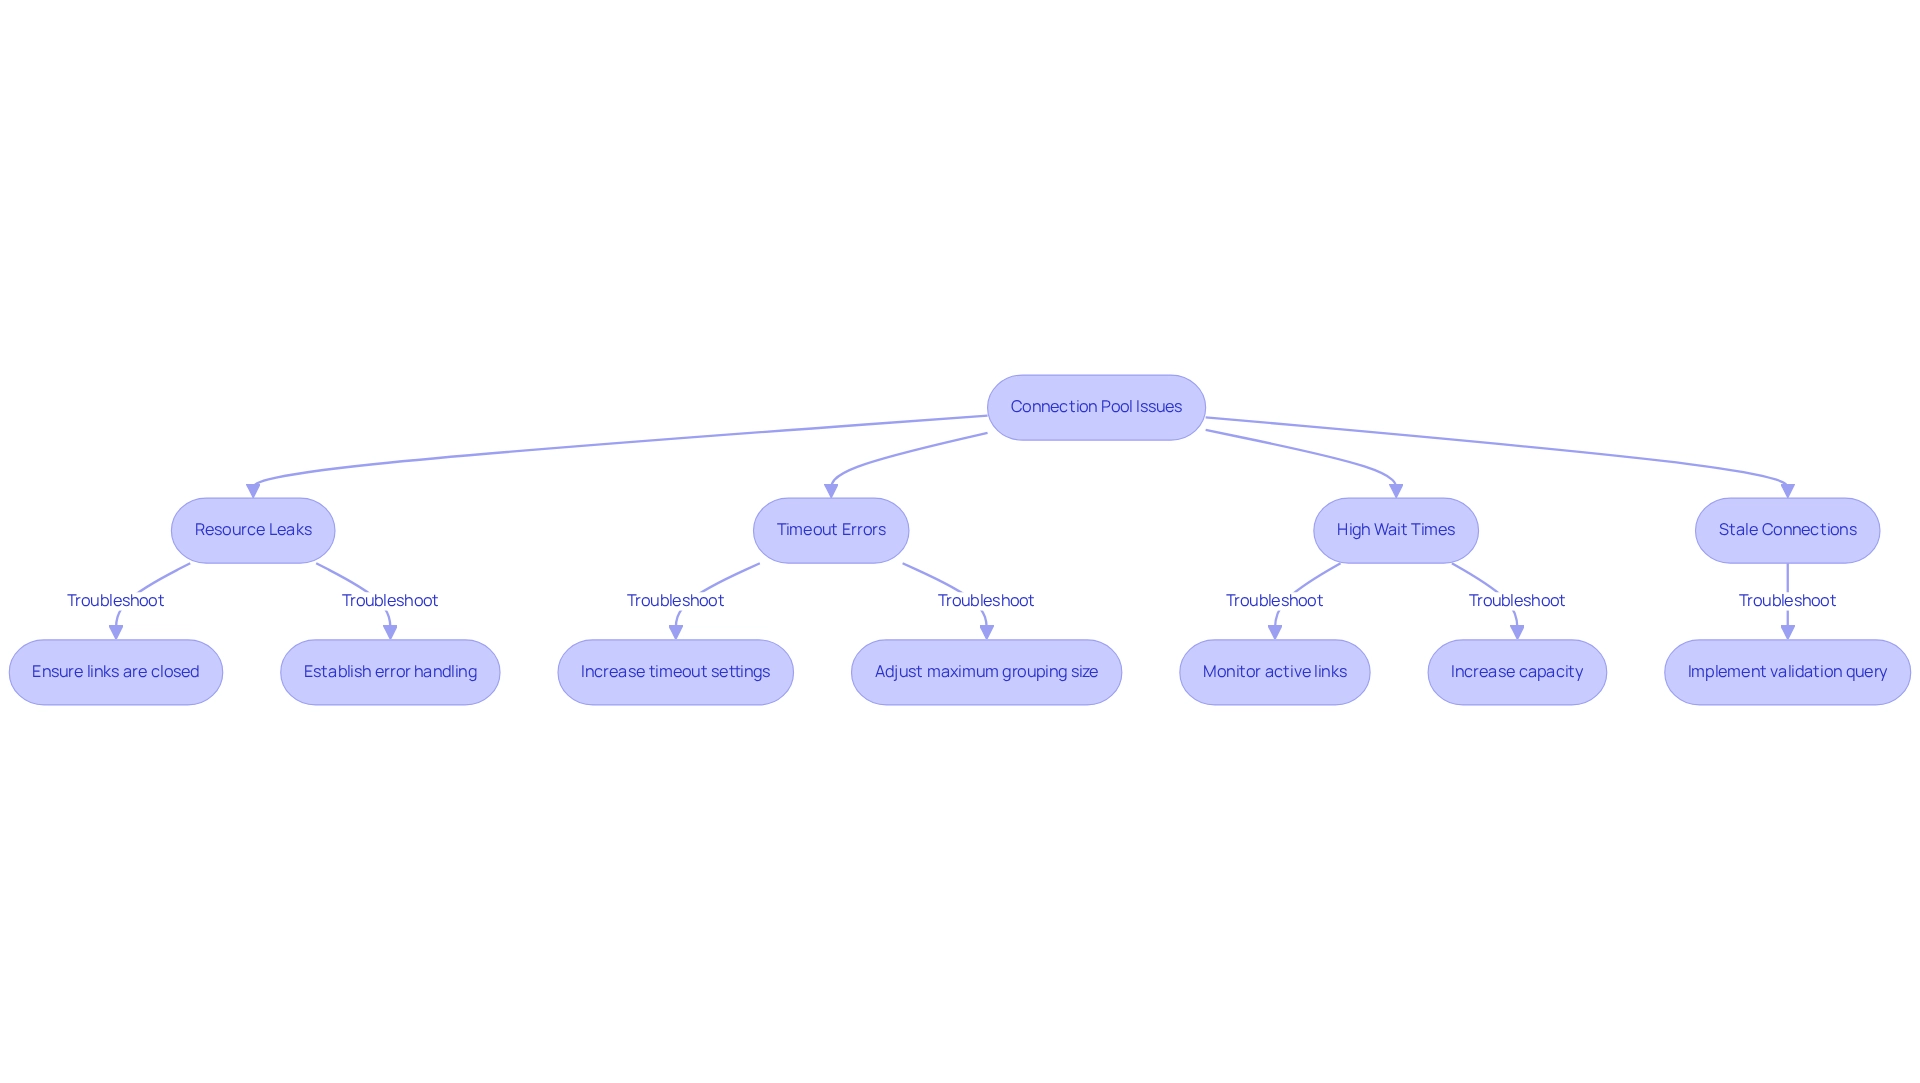
Frequent problems with resource groups can significantly impact software performance. Developers often face challenges such as resource leaks, timeout errors, high wait times, and stale connections. How can these issues be effectively addressed? Kodezi provides solutions tailored to enhance coding efficiency and reliability.
Resource Leaks: This issue arises when links are not returned to the pool after use, leading to resource depletion and potentially slowing down software performance. To troubleshoot, ensure that all links are properly closed in your application code. Establishing a robust error handling system can help capture exceptions where links might not be closed. The impact of link leaks on performance can be substantial, resulting in longer wait times for users and ultimately diminishing their experience.
Timeout Errors: Frequent timeout issues may indicate that resource allocation is either insufficient or that links are retained longer than necessary. Consider increasing timeout settings or adjusting the maximum grouping size, which defaults to 100 links. Observing the PeakBorrowedCount can provide insights into usage patterns, allowing for informed adjustments.
High Wait Times: Prolonged wait durations for links often signal that resources are inadequate for the application's demands. Regularly monitor active links and adjust the maximum group size based on usage patterns. If users report delays, it may be time to increase capacity to manage peak loads. Additionally, consider the total duration (in milliseconds) that request attempts have waited for links throughout the resource group's lifecycle, as this can indicate performance constraints.
Stale Connections: Connections can become stale if not validated before use, potentially causing errors during query execution. Implementing a validation query to check the health of links before borrowing them from the pool is a proactive measure that can prevent runtime errors and enhance overall application reliability.
Real-world examples, such as the case study of Davis AI, illustrate the importance of monitoring link-related metrics. Davis AI effectively identifies pool-related issues, such as exhausted database links, which can lead to performance slowdowns. As Davis states, "Have the Davis AI identify pool-related issues that impact end users." By defining custom events for alerting based on adaptive metric baselines, developers can improve their problem resolution capabilities.
By proactively monitoring these issues and implementing the outlined troubleshooting steps, you can maintain a healthy and efficient connection pool, ensuring optimal application performance. Explore the tools available on Kodezi to enhance your coding practices and overcome these common challenges.

Conclusion
Connection pooling is a vital technique that addresses the performance challenges developers face in database management. By maintaining a pool of reusable connections, developers can significantly reduce latency and enhance resource utilization, ultimately leading to increased scalability. Understanding the fundamentals of connection pooling, configuring optimal settings, monitoring pool health, and troubleshooting common issues are crucial for maximizing these benefits.
Key takeaways emphasize the importance of fine-tuning parameters such as max and min pool size and connection timeouts. Implementing validation queries ensures reliable application performance. Regularly monitoring connection metrics—like active and idle connections, wait times, and error rates—equips developers with the insights needed to make informed adjustments and maintain optimal performance.
Ultimately, mastering connection pooling not only accelerates response times but also strengthens the reliability of database-driven applications. As organizations increasingly depend on efficient database interactions, investing time and resources into effective connection pooling strategies will yield significant long-term advantages. Embracing these practices empowers developers to create scalable and responsive applications that meet the evolving demands of users and stakeholders alike.
Frequently Asked Questions
What is a pgx connection pool and why is it important?
A pgx connection pool is a technique for managing database links efficiently by maintaining a pool of connections that can be reused for multiple requests, rather than establishing and terminating a link for each request. This method reduces overhead, improves performance, and enhances resource usage.
How does using a pgx connection pool reduce latency?
By reusing existing connections, applications can respond more quickly to requests, which improves overall user experience. Statistics from 2025 indicate that efficient resource pooling can lead to a 30% reduction in latency for database-driven systems.
What impact does a pgx connection pool have on resource efficiency?
A pgx connection pool reduces the number of active connections, thereby easing the resource strain on the server. This is particularly important because many open idle sessions can slow down the snapshot created for each SQL statement.
How does a pgx connection pool enhance scalability?
Utilizing a pgx connection pool allows systems to support more simultaneous users without overloading the database. Proper implementation of the pool can significantly improve both the responsiveness and reliability of database-driven applications.
What is a practical example of the importance of understanding connection pooling?
In a case study regarding Active Storage Proxy Mode in Rails, it was found that understanding how Active Storage functions in proxy mode is crucial for setting up data link resources correctly. This highlights the need to master pooling fundamentals to enhance and resolve database performance effectively.


